


Written by:

- Chart of the Day
- July 4, 2024
- 2 min read
BTC Analysis (July 4th, 2024): in Danger of Dropping to 52K
With independence day going on, it’s the perfect time to analyse some assets that run 24/7…
Of course, we’re talking about Bitcoin here.
Similar to the S&P 500, analysing Bitcoin will provide a big picture of how the crypto market is generally performing at the moment – which isn’t looking too hot.
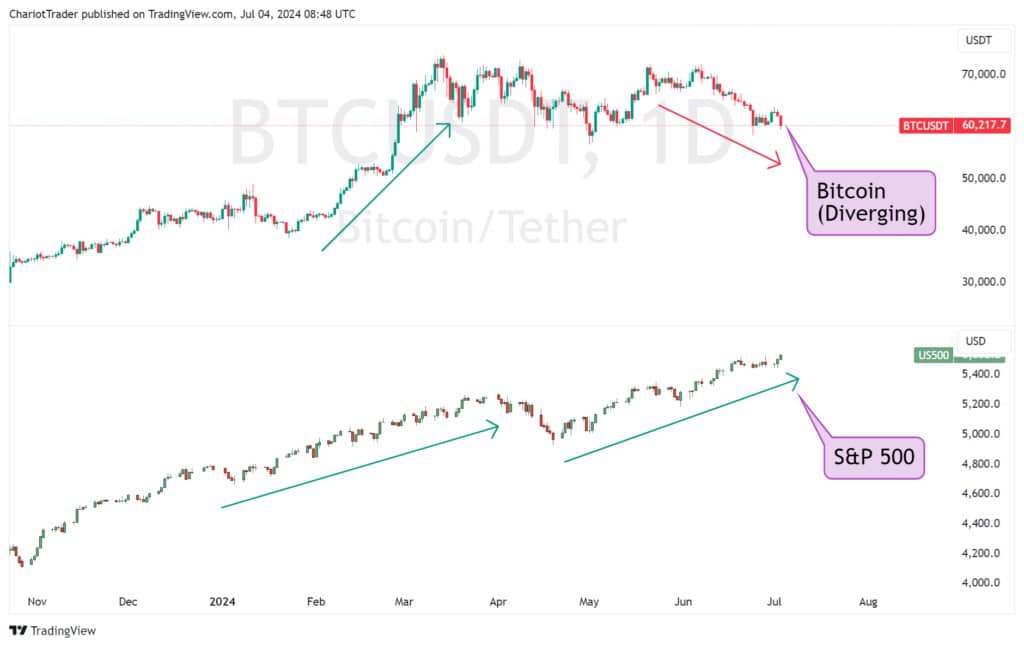
It’s important to remember that Bitcoin is usually positively correlated with the S&P 500 and Nasdaq, so the current situation is rather peculiar. The S&P 500 and Nasdaq 100 rallied to new highs yesterday, but Bitcoin has unfortunately cascaded down towards $57,800, finding support at the daily 200 EMA.
So with that being said, what could come next?
Let’s dive into the technicals and point out a few possible scenarios.
Technical Analysis of BTC (July 4th, 2024)
Trading Bitcoin in June has been challenging, with the price action indicating a potential daily ascending triangle and a possible breakout. As we enter July, the markets are stunned by the realisation that a drop to $52K is possible.
However, traders who follow technical analysis and the volume profile weren’t surprised. Let’s analyse the key factors in the chart to breathe some clarity into this situation.
Bitcoin has Broken a Daily Trendline
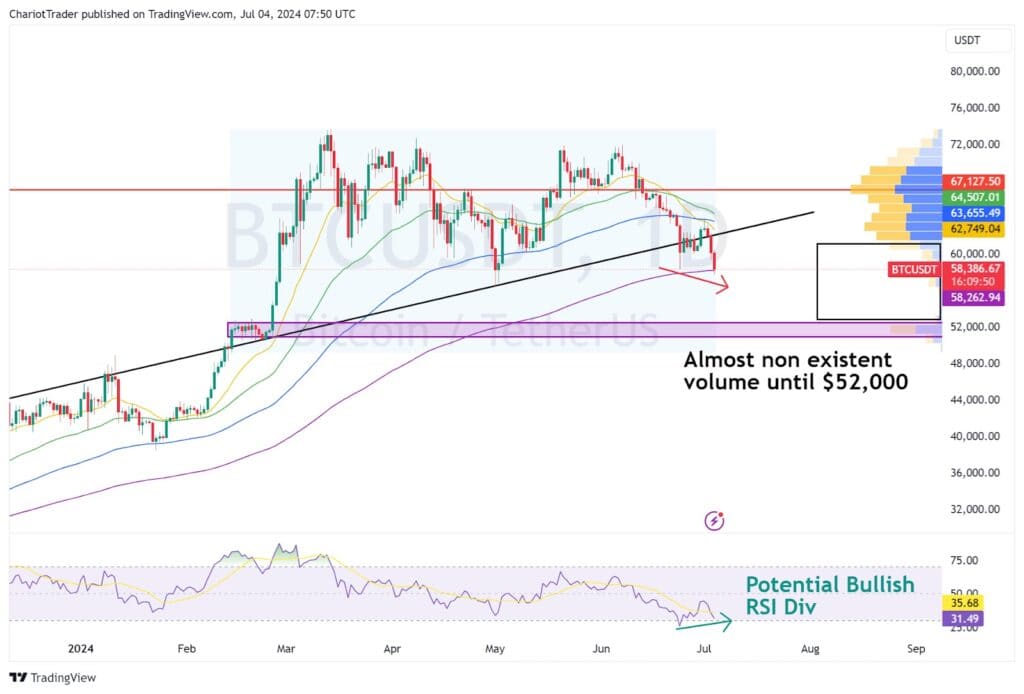
Taking the consolidation at the end of February, and the lows in May, we can draw a trendline that was even respected as a resistance level back in Q1 2024.
Currently, Bitcoin has broken past this trendline and is now resting at the daily 200 EMA, coloured in purple. We now have a situation where Bitcoin could potentially hold here and consolidate for a rise.
There’s also a potential bullish RSI divergence on the daily timeframe, so temporary relief could be on the horizon.
Alternatively, we have a situation where Bitcoin could break past this level and begin to plummet. If that were to happen, where should we look for stronger support?
Bitcoin has No Strong Support Until $52,000
Using the Anchored Volume Profile Tool, we can identify points in the chart where Bitcoin has had strong trading volume.
Unfortunately, the asset did not have any significant volume until $52,500 to $51,000. Marked with a purple box, this was where Bitcoin had previously consolidated in March.
If we were to descend towards this key level, I would keep my eyes peeled for a potential buying opportunity.
You may also be interested in:
USDCHF Elliot Wave Analysis


