


Written by:


- Chart of the Day
- October 17, 2024
- 3 min read
Bulltober Again in 2024? Bitcoin Eyes Bullish Break of $68,000
For the past 11 years, Octobers have more or less been a bullish month for the digital currency – especially during the second half of the month.
Timeline wise, this is exactly where we sit, and it’s curious to see Bitcoin retesting a major bull flag trendline, and a resistance zone at $68,000. Will history repeat itself, or will this time be different?
Historical Data for Bitcoin Octobers
Taking a look at historical price data, most of the price gain comes from October 15th onwards. Ten out of eleven years have resulted in a bullish biweekly close for the asset known as digital gold.
With this data point in mind, it is difficult to view Bitcoin with a bearish lens, at least in the mid-term.
| Year | BTC Percentage Change from Oct 15th to 31st |
| 2024 | +2.49% (As of Oct 17th) |
| 2023 | +29.25% |
| 2022 | +6.85% |
| 2021 | +6.96% |
| 2020 | +20.85% |
| 2019 | +9.71% |
| 2018 | +1.61% |
| 2017 | +13.16% |
| 2016 | +10.62% |
| 2015 | +27.29% |
| 2014 | -13.93% |
| 2013 | +49.75% |
Bitcoin has Tapped into the Resistance Zone, Could Retrace
On the daily timeframe. Bitcoin has tapped into a resistance zone formed by the wicks from July 2024, at approximately $68,250 to $70,117.
For the very moment at least, Bitcoin is seeing a rejection from this zone, which coincides with the upper trendline of a massive parallel channel.
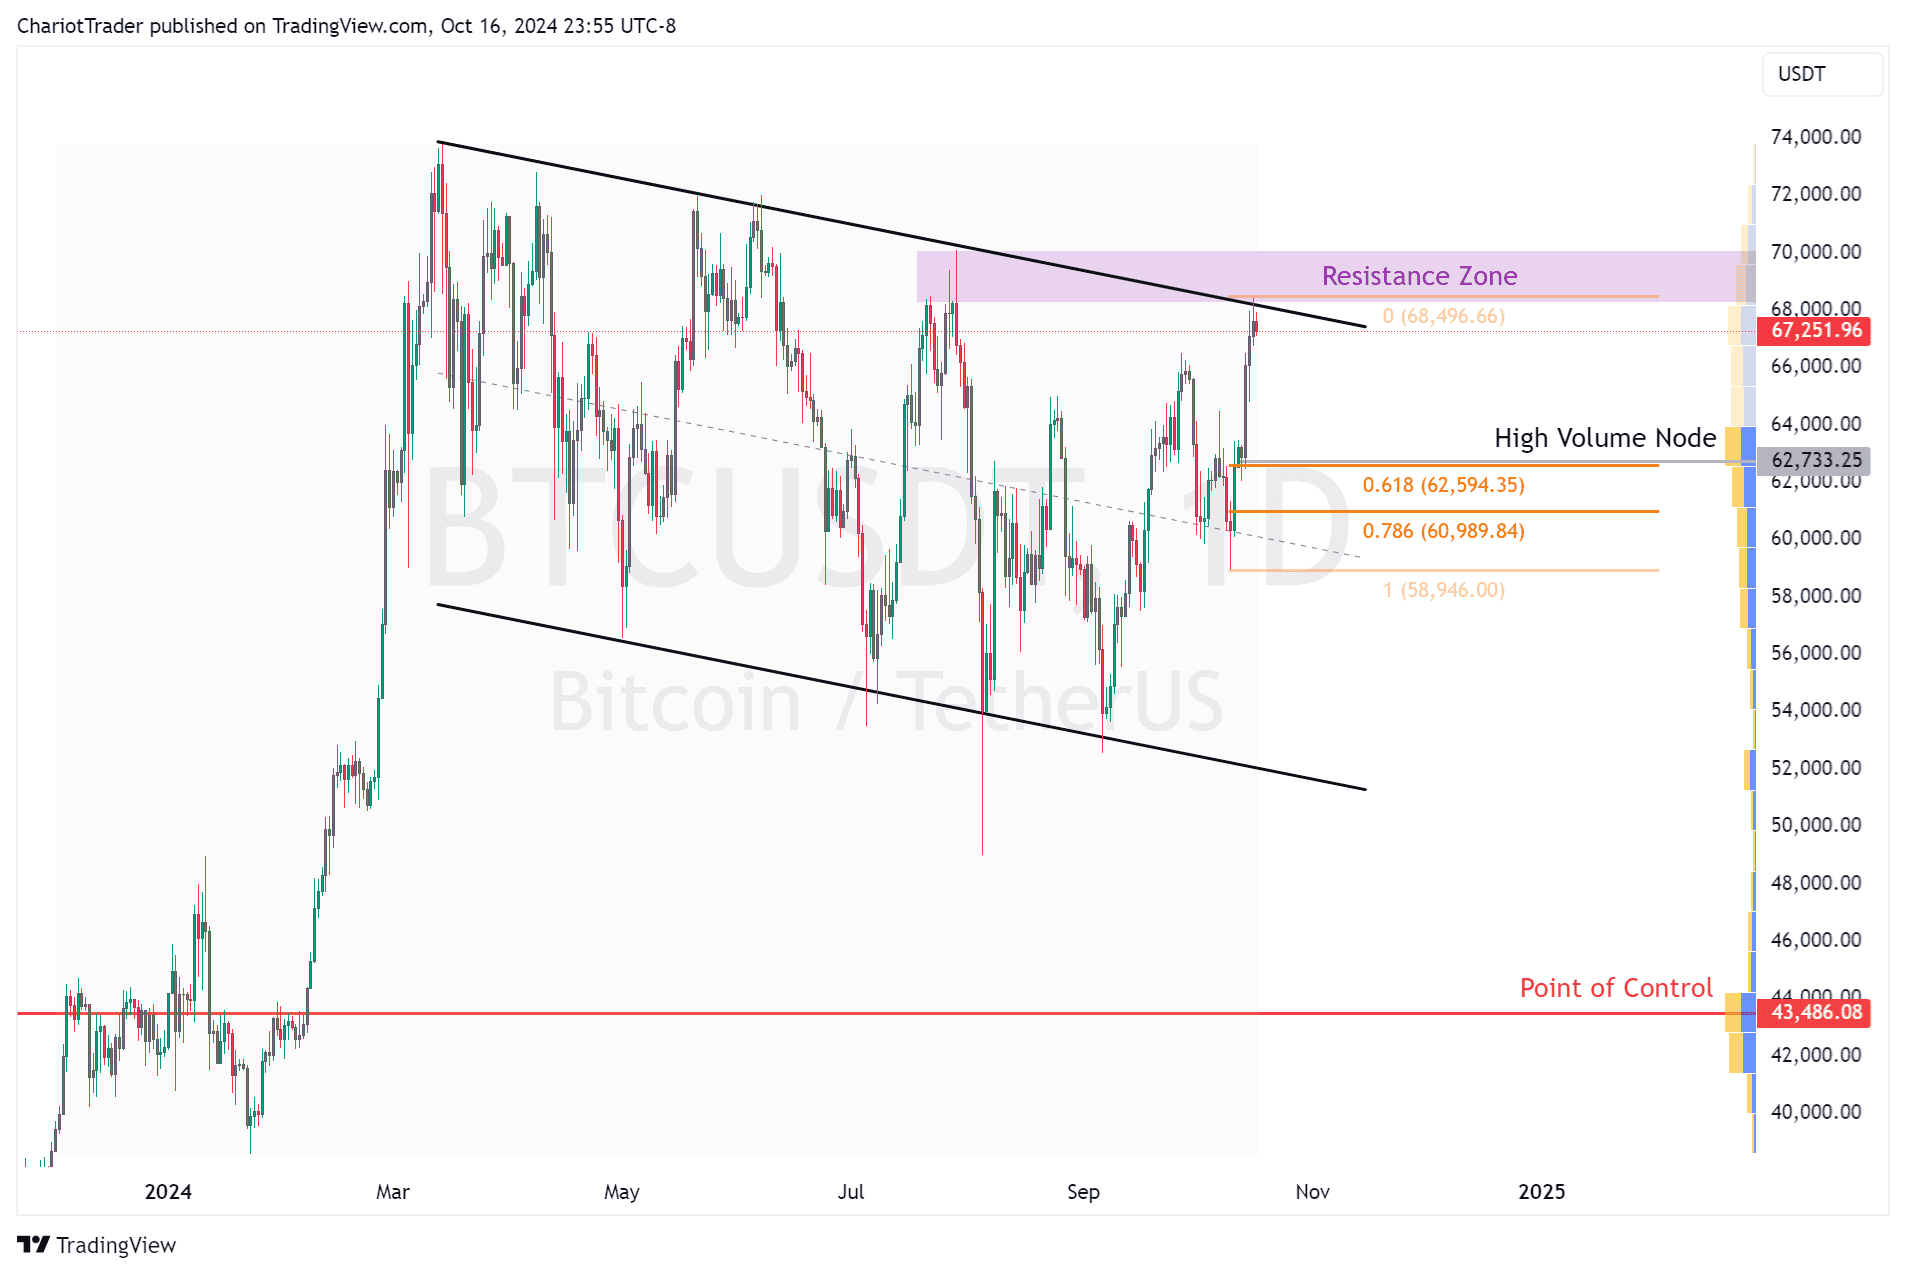
If the rejection from this zone is significant, Bitcoin could see a decline back to the $62,600 region, where the 0.618 Fibonacci Retracement level lies. This is significant as the 2024 Volume Profile drawn reveals significant trading volume, and therefore, institutional interest, at this price zone.
However, more conservative traders may look towards the round number of $66,000 as a valid support for a bounce, as that aligns with the previous pivot high in September.
Bull Flag Targets for Bitcoin Eyes $84K, $90K and $102.5K
In the event Bitcoin breaks the July 2024 resistance and closes a new swing high, we could see a parabolic rise to high targets of $90,000 or even $102,500.
This is due to a bull flag pattern on Bitcoin, which has consolidated for the good part of 2024. The pattern offers two breakout targets based on where you draw the flagpole from – but don’t expect these targets to be reached in October as both of them exceed a gain of 30%.
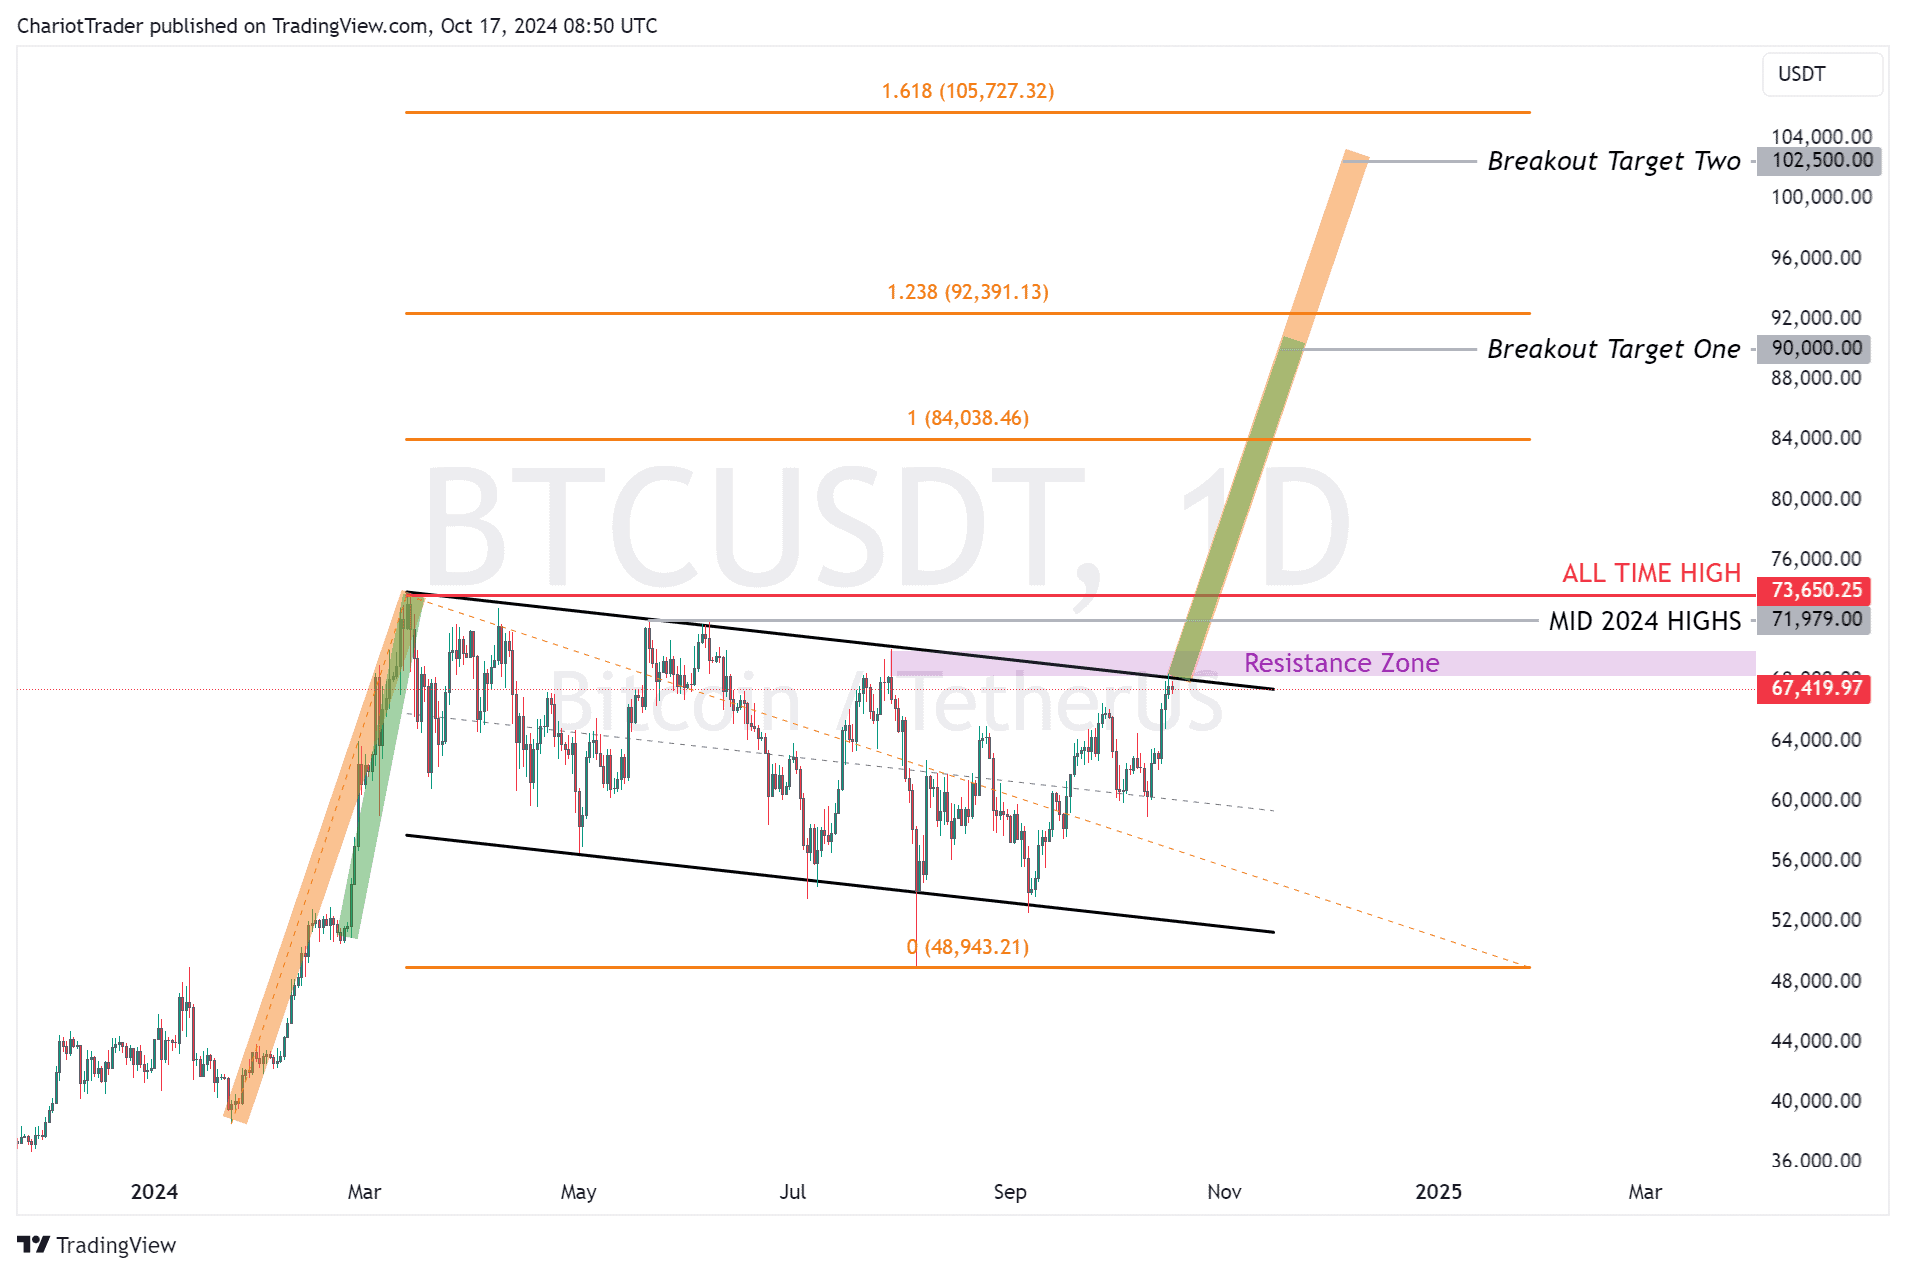
Using the Fibonacci Extension Tool, we can mark out significant take profit zones when an asset is in price discovery mode (breaking into new highs). The levels are as follows:
- Fib Extension Level (1): $84,038
- Fib Extension Level (1.238): $92.391.13
- Fib Extension Level (1.618): $105,727.32
Overall, the main targets to look at are approximately $84K, $90K, and $102.5K. With that being said, we should keep the US election in November in mind, as extreme volatility could occur and move Bitcoin’s price significantly in either direction.
You may also be interested in:
All Eyes on Tomorrow’s ECB Interest Rate Decision


