


Written by:


- Chart of the Day
- July 15, 2024
- 2 min read
AUD/USD Unfolding Triangle
The AUD/USD pair is currently exhibiting a fascinating technical pattern, unfolding into a triangle formation. This sideways movement is intriguing as it happens amidst significant fundamental developments. Following the recent shooting attempt involving former President Donald Trump, reminiscent of the attempt on Ronald Reagan’s life in 1981, Trump’s standing seems bolstered. Historically, such incidents have sometimes increased public sympathy and political support, as it did with Reagan, whose winning chances increased by 22%. Trump’s protectionist trade policies, aimed at reducing the trade deficit, are now contributing to the short-term appreciation of the dollar.
These protectionist policies involve higher tariffs and trade barriers, expected to decrease imports and, initially, exports due to retaliatory measures from trading partners. This could lead to a reduced trade deficit, increased demand for domestic goods, higher interest rates, and the dollar’s safe-haven appeal, all factors contributing to its appreciation. However, these effects depend on various factors, including the global economic environment and responses from other countries.
Technical Analysis of AUD/USD
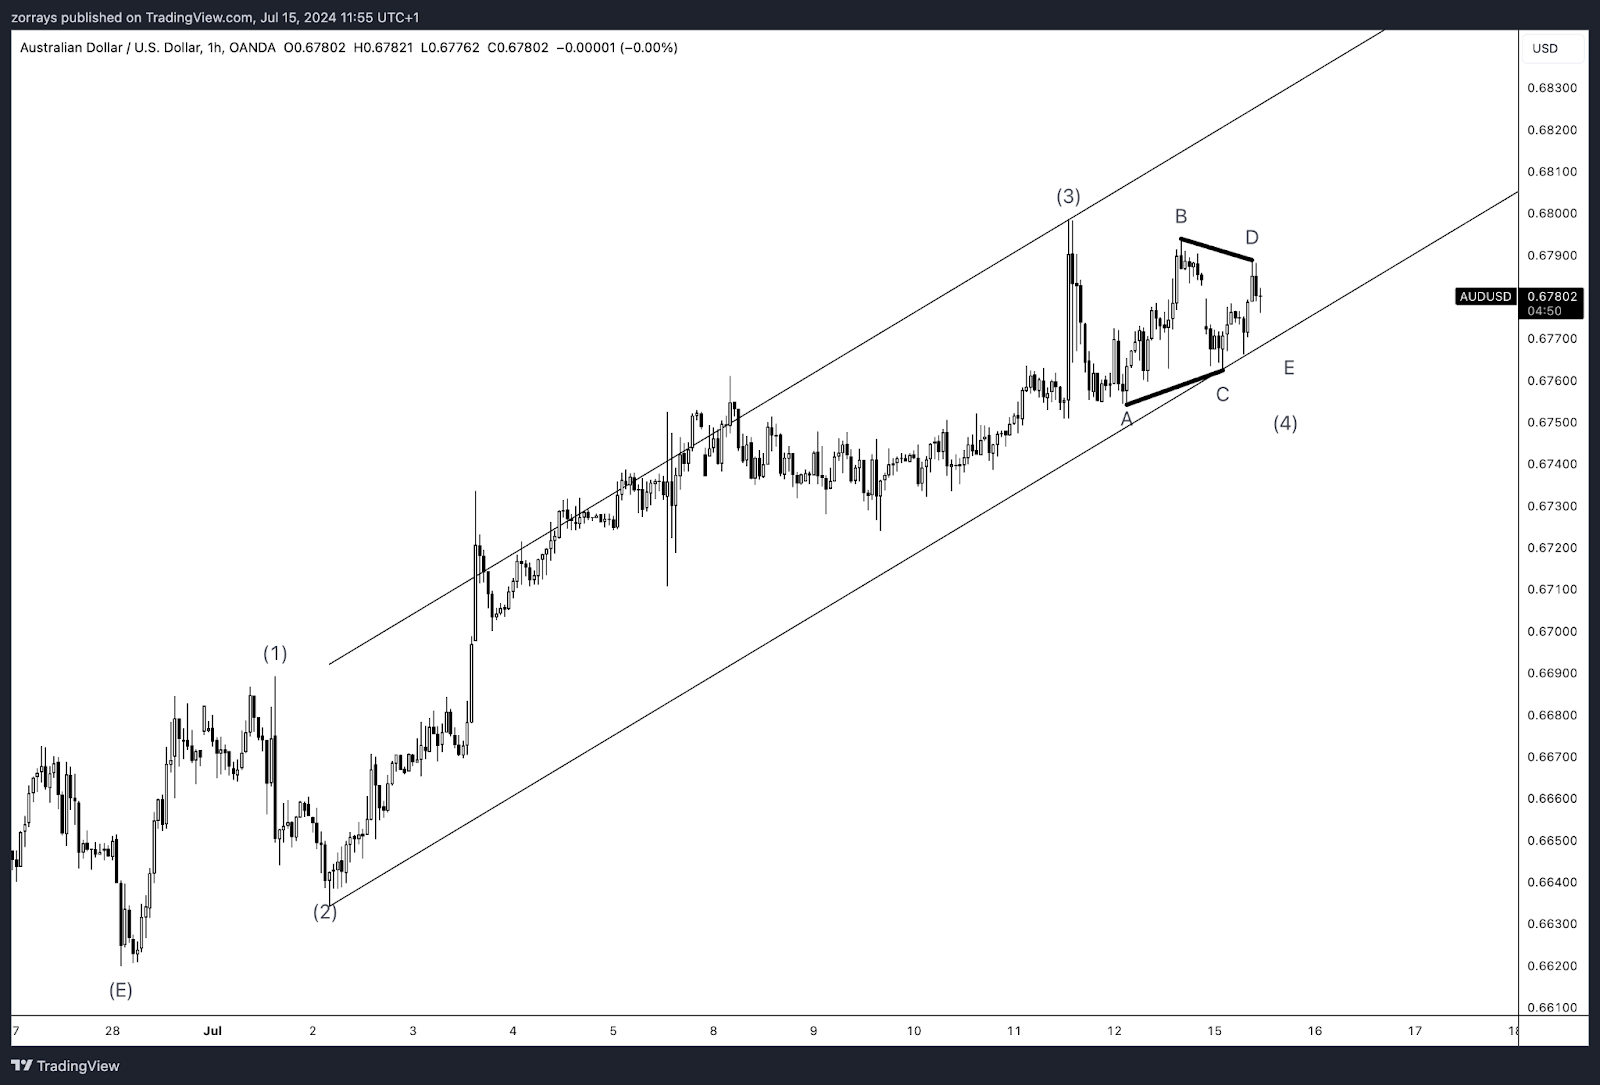
Source: TradingView
From a technical perspective, AUD/USD is currently in a corrective phase, forming a triangle within an ascending channel. The pair has seen a series of higher highs and higher lows, aligning with Elliott Wave Theory, suggesting that we are in the midst of a complex correction.
The triangle pattern is nearing its completion, with wave D and E yet to fully develop. The pair is currently trading near 0.6788, a key level to watch. The completion of wave E will likely trigger a breakout, potentially pushing the price towards the upper boundary of the ascending channel, around the 0.6830 region.
Key Technical Levels:
- Support Levels: 0.6750, 0.6730
- Resistance Levels: 0.6788, 0.6830
As the triangle nears its apex, traders should be prepared for increased volatility. A breakout above 0.6788 could see the pair targeting the upper channel boundary, providing a bullish outlook in the near term.
Conclusion
The current market dynamics are influenced by both technical patterns and significant fundamental events. The unfolding triangle in the AUD/USD suggests a potential bullish breakout, while the broader market sentiment, impacted by Trump’s recent incident and his economic policies, supports a stronger dollar. Traders should monitor the completion of wave E and the subsequent breakout, as it could present a significant trading opportunity.


