


Written by:

Reviewed by:

- March 26, 2025
- 24 min read
CFD Indices – Buy, Sell and Trade
Looking to learn how you can trade CFD indices? You’ve come to the right place!
Trading CFDs is a great way to get involved in the indices market, as it offers flexibility in your minimum deposit, trade direction, and many trading opportunities. Additionally, this means you won’t need to invest directly in an Index Fund—a solid long-term investment, but not always the best fit for every person.
Find out how to trade CFD indices with practical strategies, real examples, and get a strong head start with this guide.
What are CFD Indices?
CFD Indices, or Index CFDs, are financial contracts that allow traders to speculate on the price movements of stock market indices without actually owning them. These contracts function as an agreement between the trader and broker, where profits or losses are based on the price difference between the opening and closing trade, rather than ownership of the index itself.
What are Indices?
An index is a grouping of stocks that share a common factor—such as industry, geography, or market performance. For example, the S&P 500 tracks the 500 largest publicly traded companies in the United States.

They are not directly investable but act as a representation of market performance.Traders use indices to gauge global markets and overall market trends. If an index’s price is rising, that means the companies within that sector are generally performing well.
This can influence investor sentiment and drive even more buying on individual stocks within the sector—creating a feedback loop that reinforces market movements.
Over time, financial products have been created based on indices. Investors can buy shares in ETFs (exchange-traded funds), which track the index’s performance for long-term investing. Alternatively, traders can speculate on price changes using derivatives like CFDs, index futures, and options, which allow for short-term trading without direct ownership of the underlying stocks.
Major indices include the S&P 500, NASDAQ 100, FTSE 100, DAX 40, and Nikkei 225, among others.
How do Index CFDs work?
Index CFDs mirror the price movements of a stock market index, allowing us to trade the price of indices without owning an ETF share. For example, the S&P 500 index, notated as SPX, has the CFD version, US500. While they generally move in tandem, small price variations can occur, meaning they are not a perfect 1:1 representation.
A unique feature of CFDs is leverage. Each CFD trade is opened using leverage already built-in, allowing you to control larger positions while risking less. For example, if the leverage settings for a CFD is 20:1, that means your trade size will be amplified by 20 times. Therefore, if you opened a trade with an initial capital of $1,000, you would end up controlling a trade position worth $20,000.
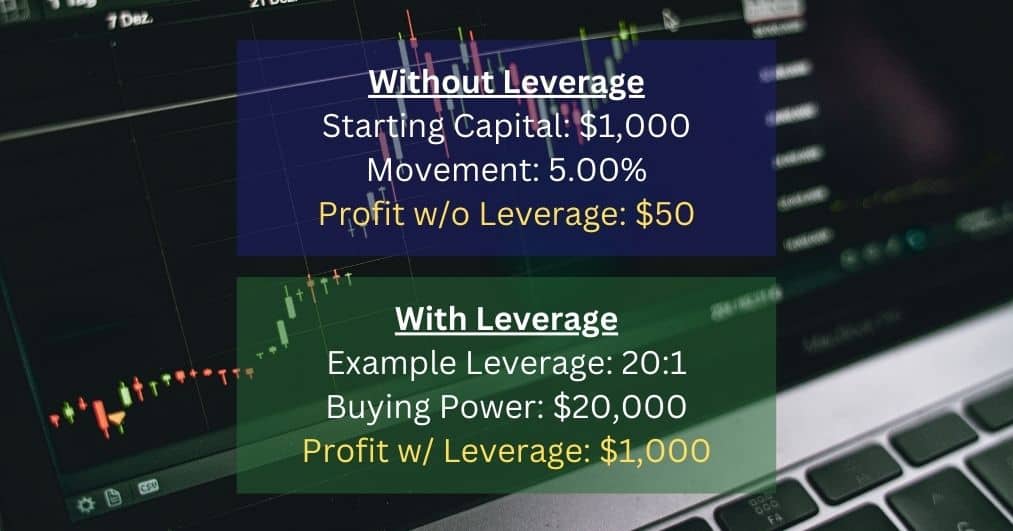
However, leverage is a double-edged sword, as it amplifies both your potential profit and losses. The bigger your trade, the bigger each pip move for or against your trade is going to be. For example, with a $20,000 trade position, 5% in favour of your trade will result in $1,000 in profits. Vice versa, 5% against your trade’s direction is going to result in $1,000 in losses.
How to Calculate Index CFDs?
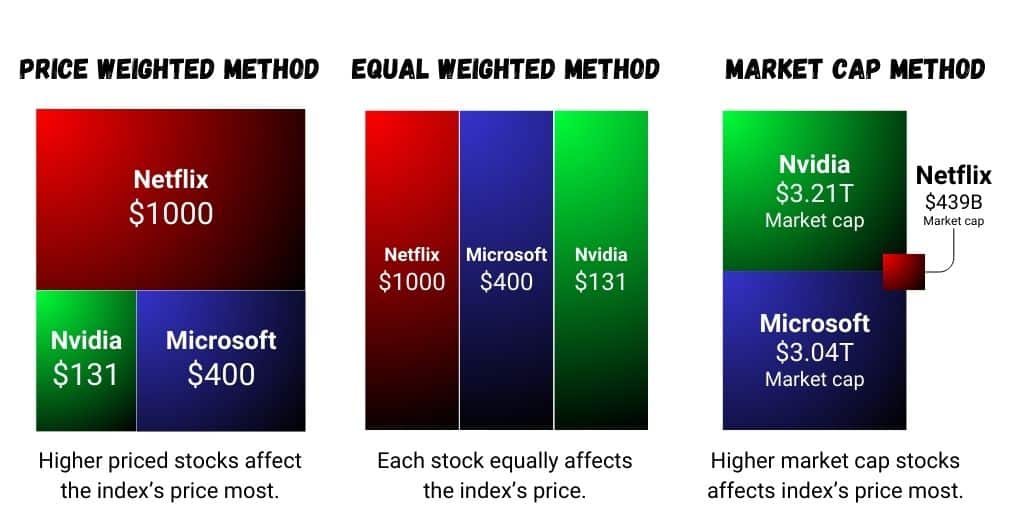
Index CFDs derive their value from the underlying stock market index, which can be calculated using three different weighting methods: price-weighted, equal-weighted, and market capitalisation-weighted. The method used affects how individual stocks influence the overall index price.
Price Weighted Method
In a price-weighted index, each stock’s weight is based on its share price rather than its market size. Higher-priced stocks have a greater influence on the index’s movement, regardless of their actual market capitalisation.
Equal Weighted Method
An equal-weighted index assigns the same weight to every stock, regardless of share price or market capitalisation. This approach gives smaller companies an equal influence on index performance compared to larger ones.
Market Capitalisation Method
A market cap-weighted index assigns weights based on the total market value of each company (share price × number of outstanding shares). Larger companies have a greater impact on the index’s movements. This is the most common method used by indices like the S&P 500, NASDAQ 100, FTSE 100, and DAX 40.
How Dividend Adjustments Affect Index CFD Trading
Many stock indices are published as price indices, meaning they reflect only the capital gains and losses of their constituent stocks—not the dividends those companies pay. In contrast, a performance (or total return) index assumes that dividends are reinvested, providing a more complete picture of market performance.
When trading index CFDs, brokers often adjust for dividend payments to reconcile the difference between the price index and a performance index. For long CFD positions, you may receive a dividend adjustment credit on ex-dividend dates—this reflects the dividend income you would have earned if you owned the underlying stocks. For short positions, the reverse occurs, and you might incur a debit.
These adjustments are crucial because they ensure that your CFD position tracks the true economic performance of the index. Failing to account for dividends could lead to unexpected discrepancies between the CFD’s price and the published index, impacting your profitability—especially if you hold positions over dividend payout dates.
Commonly Traded Indices
Indices are a favourite among traders and investors because they’re less volatile than individual stocks. Since an index is made up of multiple stocks, losses in one company can be balanced out by gains in others, keeping things more stable.
These indices are usually built around the top-performing companies in a region. The FTSE 100 represents the biggest 100 companies in the UK, while the S&P 500 and Nasdaq 100 (USTEC) track the heavy hitters in the US market.
But that’s just the tip of the iceberg! Let’s dive in and explore some of the most well-known ones.
FTSE (UK100)
| CFD Ticker | UK100 |
| What it includes | Top 100 publicly traded companies in the UK |
| Sector | Broad representation |
| Calculation Method | Market Cap |
| 1 Pip Definition | 1 full index point |
| Standard Pip Value | £1 per pip |
NASDAQ 100 (USTEC)
| CFD Ticker | USTEC |
| What it includes | Top 100 largest non-financial companies listed on the NASDAQ stock exchange in the US |
| Sector | Tech-heavy |
| Calculation Method | Market Cap |
| 1 Pip Definition | 0.25 index point |
| Standard Pip Value | $5 per pip |
Dow Jones Industrial Average (DJ30)
| CFD Ticker | DJ30 |
| What it includes | 30 major influential companies in the US, covering finance, healthcare, tech, and consumer goods |
| Sector | Blue-Chip focused |
| Calculation Method | Price Weighted |
| 1 Pip Definition | 1 full index point |
| Standard Pip Value | $1 per pip |
S&P 500 (US500)
| CFD Ticker | US500 |
| What it includes | Top 500 largest publicly traded companies in the US |
| Sector | Broad representation |
| Calculation Method | Market Cap |
| 1 Pip Definition | 0.1 index point |
| Standard Pip Value | $5 per pip |
DAX (DE30)
| CFD Ticker | DE30 |
| What it includes | Top 40 largest companies listed on the Frankfurt Stock Exchange in Germany |
| Sector | Broad representation |
| Calculation Method | Market Cap |
| 1 Pip Definition | 1 full index point |
| Standard Pip Value | €1 per pip |
Nikkei (JPN225)
| CFD Ticker | JPN225 |
| What it includes | 225 Major Companies listed on the Tokyo Stock Exchange |
| Sector | Broad representation |
| Calculation Method | Price Weighted |
| 1 Pip Definition | 1 full index point |
| Standard Pip Value | ¥100 per pip |
Russell 2000 (RUS2000)
| CFD Ticker | RUS2000 |
| What it includes | 2000 Small-Cap Companies in the US |
| Sector | Small businesses |
| Calculation Method | Market cap |
| 1 Pip Definition | 0.1 index point |
| Standard Pip Value | $5 per pip |
S&P ASX (AUS200)
| CFD Ticker | AUS200 |
| What it includes | Top 200 largest publicly traded companies on the Australian Securities Exchange (ASX) |
| Sector | Heavily weighted to Finance and Mining |
| Calculation Method | Market cap |
| 1 Pip Definition | 1 full index point |
| Standard Pip Value | AUD $1 per pip |
FTSE China 50 (CHN50U)
| CFD Ticker | CHN50U |
| What it includes | Top 50 largest Chinese companies listed on the Hong Kong Stock Exchange |
| Sector | Finance, Tech, Energy |
| Calculation Method | Market cap |
| 1 Pip Definition | 1 full index point |
| Standard Pip Value | $1 per pip |
Hang Seng Index (HKG50)
| CFD Ticker | HKG50 |
| What it includes | Top 50 largest companies listed on the Hong Kong Stock Exchange |
| Sector | Heavily weighted to Finance, Technology, Real Estate, Energy |
| Calculation Method | Market cap |
| 1 Pip Definition | 1 full index point |
| Standard Pip Value | HKD $10 per pip |
Euro Stoxx 50 (STOXX50)
| CFD Ticker | STOXX50 |
| What it includes | Top 50 largest blue-chip companies in the Eurozone |
| Sector | Focused on companies from Germany, France, Spain |
| Calculation Method | Market cap |
| 1 Pip Definition | 1 full index point |
| Standard Pip Value | €10 per pip |
Key Differences Between CFD Indices
Your success in trading CFD indices depends on how well your strategy aligns with an index’s behaviour, along with its win rate, drawdown, and the CFD’s pip value calculation.
In fact, if there’s anything to takeaway from this section, it’s this:
- Each index CFD has a different definition of a pip, and a different standard pip value.
For example, on the S&P 500 (US500 CFD), 1 pip equals 0.1 index points, with a standard value of $5 per pip. Meanwhile, the FTSE 100 (UK100 CFD) defines 1 pip as 1 full index point, valued at £1 per pip.
Understanding this is crucial for calculating appropriate lot sizes when trading index CFDs, allowing you to limit potential losses, and also speculate on potential profits across a series of trades.
CFD Indices Trading Example
In this 1H S&P 500 chart below, we see a long trade opened with 1 standard lot, which is equal to $100,000 in value, at the entry price of $6,000. The profit target is $6,085, and the stop loss is $5,957.5 – which translates to 850 pips in profits, and 425 pips in risk.

By multiplying the profit target in pips by the standard value per pip, we can get the estimated profit of this trade, amounting to $4,250. On the flip side, the risk would be around $2,125, as this trade has a 1:2 risk-to-reward ratio.
Advantages of Index CFD trading
Index CFD trading offers anybody the opportunity to speculate on price changes in a regional market, technologies market, or a sector of businesses — without investing a large sum of money into an ETF. Arguably, the gains you can get from index CFD trading can outspeed investment returns from Index ETFs, which offer a slow and steady return.
- Higher Buying Power: The leverage offered by brokers in CFD trading increase buying power, allowing you to engage in Index CFD trading with minimal initial deposit. Due to the higher buying power, returns from CFD trading can also be higher, and faster than simply investing in an ETF.
- Variety of Markets: There is a high variety of indices to choose from, providing traders an abundance of opportunities to get involved in price speculation.
- No ownership: Compared to owning and trading an ETF, you can trade index CFDs without owning the underlying asset. Additionally, your liquidity would not be tied to an asset in the long term, which could be a preference of some traders.
- Variance of Strategies: Compared to ETFs, CFD trading offers more strategies. Traders can hedge, short sell, trade swaps, and use leverage to amplify gains or losses. ETFs mainly follow a buy-and-hold approach, with profits coming from price appreciation or dividends.
Disadvantages of Index CFD trading
Just as there are advantages of Index CFD trading, the practice does come with a few downsides to consider.
- Allure of Leverage: Leverage is a double-edged sword, just as it can increase your potential profits, it also increases your potential losses. Novice and even seasoned traders can slip up on their risk management, leading to large financial losses.
- Lower Volatility: Compared to stocks and crypto, the lower volatility of indices means fewer opportunities in day trading and scalping—except during falling markets, when volatility spikes.
- Less Stable Returns compared to ETF: Although CFD trading can get potential higher returns at a higher pace compared to investing in an ETF, the risks of losing may balance out your gains — or potentially even put you in the negative. A profitable ETF, although slower in returns, will still remain profitable in the long run.
- Requires Good Risk Management: When it comes to consistently profitable trading, risk management is key. Traders without a good grasp on this may not benefit from trading index CFDs in the long run.
CFD Indices Trading Strategies
Hedging
Hedging involves taking an opposite trade to your active position to reduce risk. Essentially, you’re counter-trading yourself—having both long and short trades active at the same time to protect against market swings.
In order for hedging to work effectively, you should be trading at key support or resistance levels, or at least with a setup that has a 50/50 chance to either break out or reverse. Hedging works effectively in settings where market conditions are ambiguous, as it allows traders to benefit from price movement in both directions.
Here is an example of hedging with a simple support and resistance strategy:
In this US500 (S&P 500) 1H chart, the trend is initially bearish. As price drops, it forms a pivot around $5,810, where it briefly reverses before resuming the downtrend.
However, price eventually reclaims $5,810, turning the zone into a support level and signalling a potential trend shift. This gives us the opportunity to look for a long trade, countering the overall trend direction, in case the market does reverse.
Then, as the price climbs higher and rejects at $5,870 resistance, we enter a short trade in the overall trend’s direction (bearish). This gives us two active trades: one long, one short, at key levels.
When price eventually rallies, the long position wins, offsetting the losses from the short trade.
This strategy helps manage risk by ensuring that one position will likely secure profits, while giving up risk-to-reward as the other will suffer some minimal losses.
Another use case of hedging is when trading chart patterns.
If you understand what to look for, how a pattern forms and where the breakout is expected etc, you can enter a long and short position during the consolidation phase of the pattern, benefiting from the breakout regardless of direction. This can also help you be prepared for fakeouts, a scenario where a breakout appears to happen, but is quickly reversed.
For example, check out this triangle chart pattern on the Dow Jones (US30) daily chart:
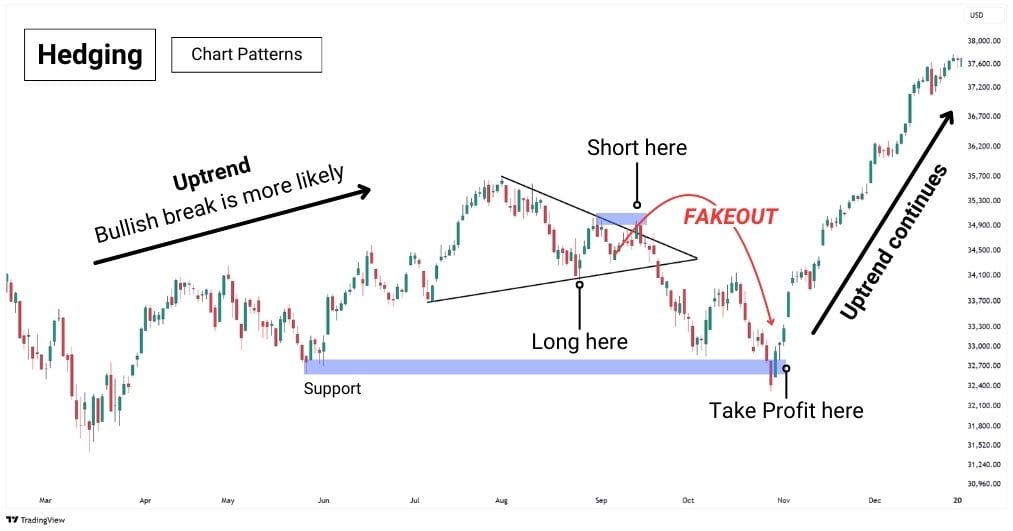
The triangle breaks upwards following an uptrend, which should signal a bullish rally. However, traders who are prepared may look for a fakeout instead, hedging their positions and helping protect their capital.
To apply hedging effectively, you’d need a strong understanding of chart patterns, and support and resistance trading.
Trend Following
There’s a well-known saying in trading: “The trend is your friend, until the end.”
Looking at the bigger picture, indices generally remain in an uptrend over time. For example, a weekly Dow Jones chart spanning 50 years shows a clear long-term bullish trend, showing why long trades tend to be the safer bet.
Research from an institutional investment firm shows bear markets occur every 3.6 years on average and last 9.6 months, while bull markets last around 2.7 years. This highlights why long positions with the trend following strategy tend to be the better play.
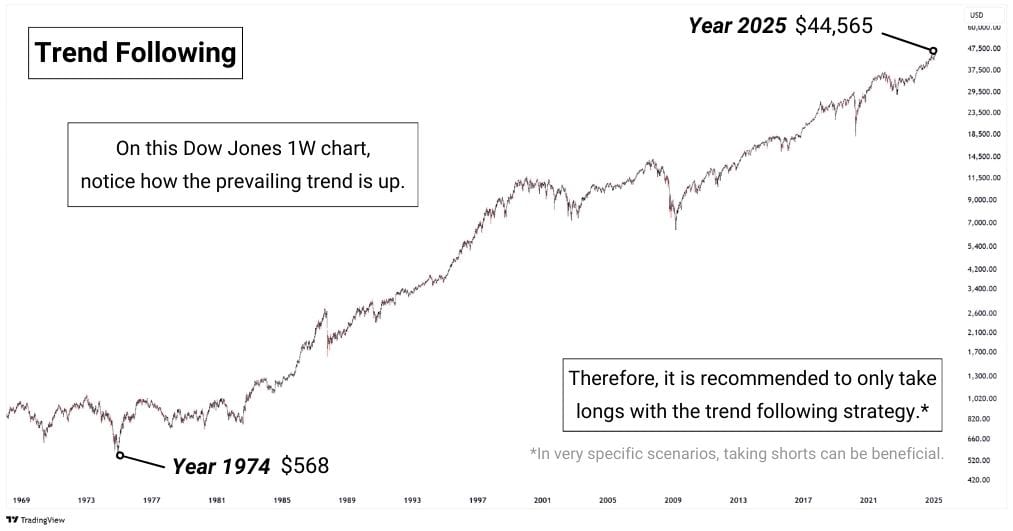
This approach favours long positions on higher timeframes such as 4H, daily, and weekly. However, going short can just as profitable if you practice good risk management. In general, it is not recommended unless we’re in a bear market.
Here is a trading strategy you can use with the trend following approach:
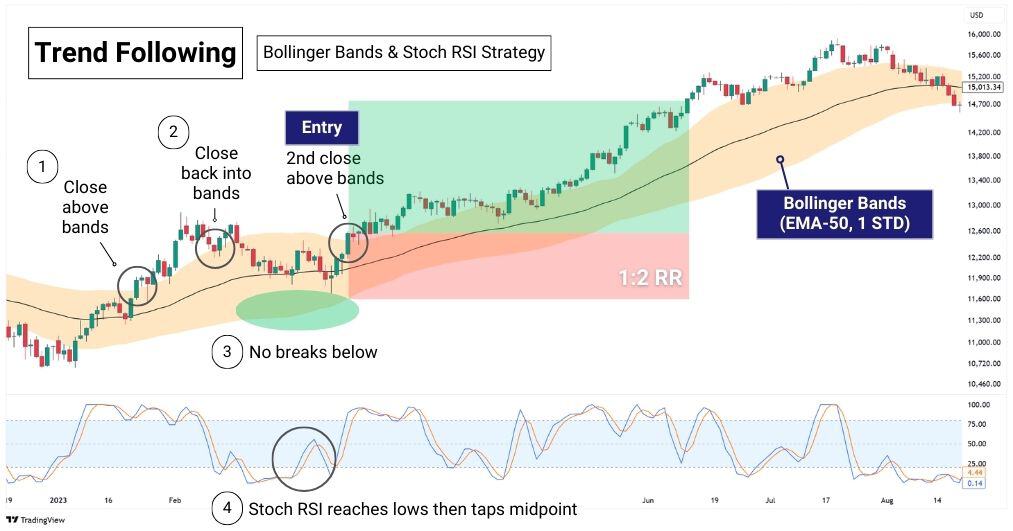
This Bollinger Bands® and Stochastics RSI strategy works well in a bull market (so most of the time). We will only take long trades exclusively. The recommended timeframe is 1H, 4H, and 1D.
The Bollinger Bands are set to following the 50-Exponential Moving Average, with standard deviation set to 1. This shrinks the bands’ size, giving traders the ability to spot breakouts when a candle closes above the bands. Next, we’ll use the Stochastic RSI to confirm the presence of strong bullish momentum. Without strong momentum backing our rally, the Bollinger Band’s breakout signal alone could provide many premature entries.
When put together, the strategy looks like this:
- The price closes above the Bollinger Bands (EMA-50, 1 STD), demonstrating the potential for a breakout rally.
- The price closes back within the bands, but never below.
- Wait for the price to close above the bands again, confirming the likelihood of rally.
- Enter a long trade if the Stochastic RSI has dipped into the oversold lows (<25) and then tapped into the midpoint (50).
- This gives us a better edge in our long trade, as it hints at bearish exhaustion and rising bullish momentum.
- The recommended stop loss placement is the lower band’s position, with a 1:2 risk-to-reward ratio (or until a candle closes below the lower band).
| Keynote: Always wait for a 2nd breakout to confirm the trade. |
This strategy is best applied at the end of a bullish pullback, a minor downtrend amidst a larger uptrend. As shown below, we can clearly see this strategy work on the Hang Seng Index, 1H timeframe.

Mean Reversion
Mean reversion strategies rely on the idea that markets tend to return to fair value after large price swings. When buyers or sellers exhaust momentum, price naturally gravitates back to a mean level—often identified using VWAP (Volume-Weighted Average Price) or the 200-Moving Average.
There are various mean reversion strategies—some use RSI divergence to detect weakening momentum, while others rely on Bollinger Bands or VWAP to highlight overextensions.
The strategy we’re sharing focuses on day trading mean reversion using VWAP and RSI on the 5-minute and 1-minute timeframes. This setup helps identify short-term price deviations and potential reversals back to fair value.
Here is an example of this strategy on the US500 (S&P 500 CFD) chart, 5-minute timeframe:
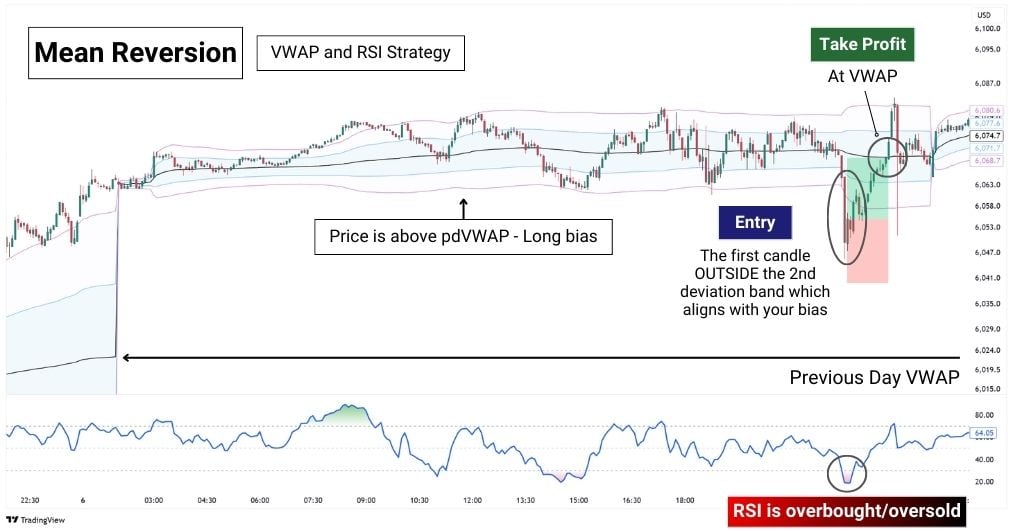
To trade this strategy, set your VWAP to daily session, and display two standard deviation bands. This will help us identify only extreme overextensions for daytrading. Then, apply the RSI with the default 14-length setting, and overbought signals at 70, oversold at 30.
Piecing it altogether, the strategy looks like this:
- Draw the horizontal line at where the vWAP last was on the previous day.
- Your trade bias will depend on the price’s location in relation to the Previous Day VWAP (pdVWAP):
- Look for longs if price is above pdVWAP.
- Look for shorts if price is below pdVWAP.
- After price exceeds the second deviation band, and the RSI is overbought or oversold, enter a trade if a candle forms in the direction of your bias.
- Place stop loss below the lowest wick, but generous distance is advised.
- Take profit at the VWAP.
There are several key considerations when trading mean reversion strategies.
The first is that your stop loss should have a wide distance from entry. This is because we are countertrading a strong breakout, which could head further away from the current price. Although we have the RSI oversold/overbought to help us filter out these conditions, it’s never a guarantee that the price wouldn’t continue its trend (before reverting back to mean). In fact, there is an entire strategy focusing on trading price when it revisits the Previous Day VWAP.
Secondly, your risk-to-reward ratio may dip below 1:1. Since the average price is dynamic, it will constantly be shifting locations as new price action unfolds, potentially reducing your RR to 1:1 or below. A risk-to-reward ratio this low is typically frowned upon in trading because you stand to lose more than you gain.
However, with solid risk management and proper trade selection, mean reversion remains a viable and widely used strategy, working best in sideways market conditions such as the US500 example above.
Swing Trading
Swing trading involves holding trades for multiple days or weeks, making it ideal for those who prefer big-picture trading over frequent chart monitoring. Indices have lower volatility compared to stocks and crypto, which make them well-suited for swing trading!
A swing trader typically starts analysis on the daily or weekly timeframe, then refines entries on the 4H or 1H charts. These analyses can be kept simple with basic support and resistance, chart patterns, volume analysis, and momentum.
As higher timeframe candles carry more significance, simple technical analysis concepts tend to be the bread and butter of swing traders.
Here is an example of what Swing Trading with Chart Patterns look like:
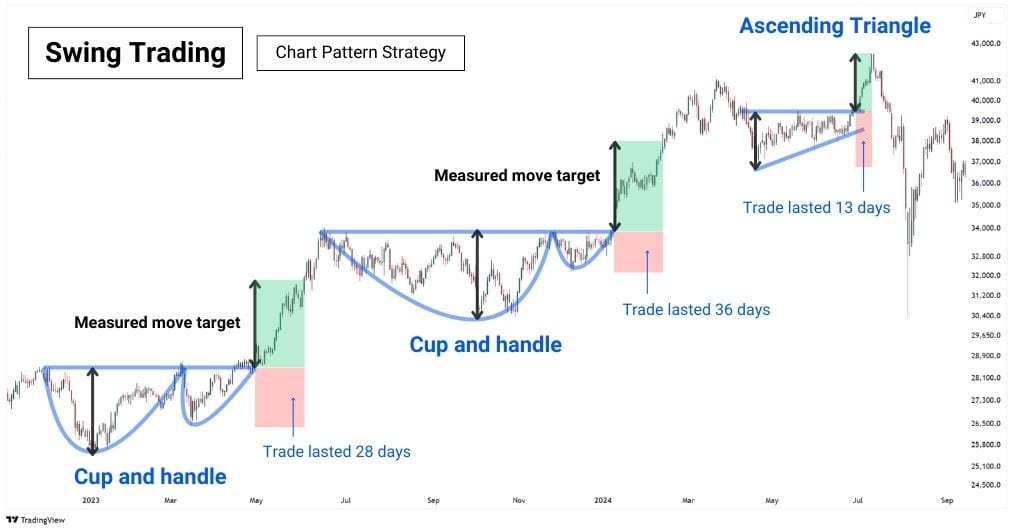
On this Nikkei (JPN 225) Daily Chart, we can see multiple chart patterns develop: Cup and Handle, Ascending Triangle, with different measured move targets, and holding time per trade. Typically, chart patterns can take an enormous amount of time to develop on the daily timeframe, bu they tend to be reliable and play out consistently.
Swing traders can capitalise on these signals with well-defined entry, stop loss, and take profit levels, making for a relatively straightforward approach. However, this strategy can be unforgiving to impatient or greedy traders who:
- Oversize their positions – Many chart patterns require a wide stop loss, making excessive risk a quick way to blow up.
- Jump in too early – Premature entries often mean getting chopped up in price action before the pattern fully forms.
| Tip: Measured move target is the expected distance when a chart breaks in a direction. Typically, it is distance between the highest high of the pattern, to the lowest low. |
Trade Index CFDs Today with Tier 1 Liquidity and Zero Commissions
Start trading with Alchemy Markets, where we provide Tier-One Liquidity and zero-commission trading on forex, precious metals, and indices. Partnering with over 20+ Tier-One banks and non-bank entities, we ensure that your trades are executed at the fairest prices, with seamless entries and exits.
For VIP Accounts, we offer raw spreads and even lower commissions, giving them an extra edge in the markets.
How to Trade Indices CFDs
With Alchemy Markets, you can place your first trade today with just a $100 minimum deposit and enjoy trading with no commission fees!
Trade from a wide array of global indices, such as S&P 500, NASDAQ 100, FTSE 100, DAX 40, Nikkei 225, and more.
Index Mutual Funds vs Index CFDs
Index mutual funds are investment products managed by fund managers who buy stocks within an index to mirror its performance. While these funds track an index’s gains and losses, they are not the index itself. Investors can buy shares in the fund, benefit from its appreciation, and sell them later for a profit—similar to how they would trade individual stocks.
Index CFDs, on the other hand, work more like placing bets on an index’s price movements. Traders don’t own any part of the index but use leverage to speculate on whether prices will rise or fall. This allows them to profit from both upward and downward moves without actually holding the underlying assets. Unlike index mutual funds, CFDs also let traders short-sell the index without first owning it, making them a more flexible but riskier option.
Index ETFs vs ETF CFDs
Index ETFs (Exchange-Traded Funds) and ETF CFDs may both track an index, but they operate in very different ways. An index ETF is an investment fund that actually holds the underlying assets of the index it tracks, just like an index mutual fund.
ETF CFDs, on the other hand, don’t involve owning any actual assets. Instead, traders speculate on the price movements of an ETF using leverage. This allows them to go long or short without holding the ETF itself, making them a flexible alternative to traditional markets like ETFs.
Index CFDs and Stock CFDs
Both Index CFDs and Stock CFDs are derivative instruments that allow traders to speculate on price movements without owning the underlying assets. The primary difference lies in the underlying asset—while index CFDs track indices, stock CFDs track stock prices.
Understanding Leverage and Margin in Index CFD Trading
Whenever you trade a CFD, your broker applies a preset amount of leverage to your position, increasing your trade size by that many times. For example, if your broker offers 20:1 leverage on index CFDs, a $50 margin would control a $1,000 position. This means price movements will have 20 times the impact compared to trading without leverage.
On the S&P 500, the pip value for one standard lot (100 contracts) is $5 per pip. If you were trading a mini lot (10 contracts), each pip would be worth $0.50, and for a micro lot (1 contract), each pip would be worth $0.05.
With 20:1 leverage, your $50 margin controls $1,000 worth of S&P 500 CFDs. If you’re trading one mini lot (10 contracts), each pip move would be worth $0.50, meaning a 10-pip move would result in a $5 profit or loss. Whereas originally, without leverage, a 10-pip move in would just result in a $0.50 profit or loss, compared to the $5 move with 20:1 leverage when trading a mini lot.
This feature effectively reduces the amount of margin (cash) you need to put up per trade, allowing you to diversify across multiple assets—while managing your trading positions efficiently. However, it’s important to realise that risk management is crucial when trading with leverage, as every loss is amplified that many times as well as potential profits.
What are the Common Terms Used in Index CFD Trading?
It’s crucial to understand the basic terms used in index CFD trading to achieve consistency in your trading. Here are a few common terms you should know:
| Term | Definition |
| CFD | Contract for Difference, a derivative that lets traders speculate on index price movements without owning the underlying asset. |
| Index | A basket of stocks representing a market or sector, like the S&P 500 or FTSE 100. |
| Pip | The smallest price movement in an index CFD, varying by index and trade size. |
| Trade Size | The total value of a CFD position, determined by the number of contracts and the index price. |
| Long Position | Buying an index CFD expecting the price to rise. |
| Short Position | Selling an index CFD expecting the price to fall. |
| Market Order | A trade executed at the current market price. |
| Limit Order | A trade set to execute at a specific price. |
| Initial Margin | The minimum deposit you commit when opening a trade position. |
| Maintenance Margin | The minimum balance required to keep a position open. |
| Margin Call | A broker’s warning to add funds or close positions due to low account equity. |
| Liquidation | Forced closing of positions when the maintenance margin is not met. |
FAQ
Where does the index CFD price come from?
Index CFD prices are derived from the underlying index they track. Brokers source prices from major exchanges and liquidity providers, ensuring CFDs move in sync with the real index, though small variations can occur due to spreads and execution factors.
What Leads to Index Price Movement?
Index prices fluctuate based on the performance of the stocks within them. Major factors include economic data, interest rates, earnings reports, geopolitical events, and overall market sentiment.
What are the Different Types of Indices CFDs?
Index CFDs come in various types, including broad market indices (S&P 500, FTSE 100), sector-specific indices (NASDAQ 100 for tech), and regional indices (DAX 40 for Germany, Nikkei 225 for Japan).
What are the Best Times to Trade CFDs Indices?
The most active trading hours are when major stock exchanges are open. Volatility peaks during market openings (e.g., 9:30 AM–11:30 AM EST for U.S. indices) and during overlapping sessions like London-New York (1:00 PM–4:00 PM GMT).
How much capital do you need to trade CFDs Indices?
This depends on your broker’s margin requirements. With leverage, you can open positions with a fraction of the total trade size. For example, with 20:1 leverage, a $1,000 position requires just $50 in margin.
What is the size of a CFDs Index?
The size varies by index and broker. A standard lot is typically one contract, where each pip movement has a set value. For instance, on the S&P 500 (US500 CFD), 1 pip = 0.1 index points, with a $5 per pip standard lot value.
What are the fees in CFDs Index trading?
Trading costs include spreads (the difference between bid and ask prices), overnight financing (swap rates on leveraged positions held overnight), and sometimes commissions, though many brokers offer zero-commission trading. On Alchemy Markets, you can trade Index CFDs with zero commissions on all account types. In addition, you can trade CFD indices with raw spreads using our VIP account.
What are the common mistakes made in CFD Index trading?
Over-leveraging and neglecting proper risk management are among the most common mistakes. Traders also overlook factors like pip value variations, which can lead to unexpected losses.
Are CFD Indices suitable for beginners?
CFD Indices can be accessible for beginners due to lower capital requirements and the flexibility of leverage. However, they require a solid understanding of market dynamics and strict risk management to avoid significant losses.
How do brokers set spreads for Index CFDs?
Brokers set spreads based on the liquidity of the underlying index, market volatility, and competitive market conditions. The spread represents the cost of trading and can fluctuate throughout the trading day.
What is the typical leverage offered on Index CFDs?
Leverage on Index CFDs typically range up to 100:1*, though it may vary by broker, your jurisdiction, and specific index. Higher leverage can magnify both profits and losses, making careful risk management essential. Conditions apply.


