Log in Sign up

AUD/USD: A Hawkish Hold, a Hesitant Aussie

The Reserve Bank blinked first — but not the way the Aussie wanted.

The RBA held the cash rate at 4.35% this morning, snapping a three-meeting hiking streak and delivering exactly what the market had penciled in. Yet the decision arrived wrapped in a familiar warning: this is a pause, not a pivot. Governor Bullock kept the door to further tightening firmly ajar, reminding traders that inflation — still running near 3.4% on the underlying measure — remains the central concern, with higher fuel and commodity costs now bleeding into housing and construction.

Here’s the catch the market is wrestling with: a hawkish hold should support a currency. Instead, short-term rates drifted lower and the Aussie struggled to find a bid. Why? Because for AUD/USD right now, the RBA isn’t the one holding the pen — the Fed is.

With the US central bank settling into a prolonged hold of its own and the dollar reclaiming ground lost after the Iran de-escalation, the rate-differential story that would normally lift the Aussie on a hawkish RBA simply isn’t firing. Bullock can sound as vigilant as she likes; until the Fed narrative softens, the Aussie’s upside stays on a short leash. The second-half bull case — the one that points toward 0.73 — leans almost entirely on US data cracking, not Australian rates climbing.

So the market knows the RBA is on hold. What it might be missing is that the next leg for AUD/USD probably won’t be written in Sydney at all.


The Chart

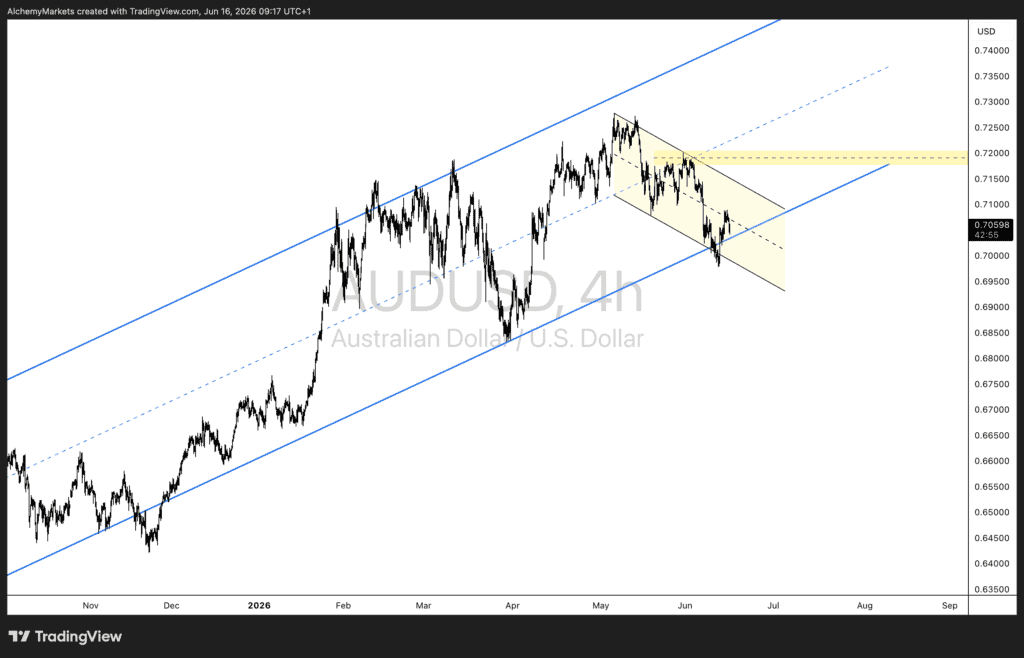
The price action tells the same story of suppressed momentum. On the 4-hour, AUD/USD continues to track inside the broad ascending channel that has framed the entire move higher since November — the structural uptrend is not broken.

But zoom in, and the near-term picture is more cautious. Since topping out near 0.7270 in early May, price has been carving lower inside a descending channel — a corrective drift that has guided the Aussie down toward the 0.7000 handle, where it found support and is now attempting to recover back toward the channel’s midline around current levels near 0.7060.

The level that matters sits overhead. 0.72 is our initial resistance projection — the prior pivot zone and the area where the descending channel’s upper boundary now converges. As long as price trades beneath it, the corrective structure stays intact and rallies are best read as tests rather than breakouts. A clean reclaim of 0.72 would be the first real signal that the May–June drift is over and the broader uptrend is ready to reassert.

Until then, the Aussie is caught between two channels and two central banks — supported by structure, capped by the dollar, and waiting for a catalyst it can’t supply itself.

Two central banks, one currency

RBA vs Fed policy rates · Jun 2023 – Jun 2026

Current (Jun 2026)

4.35% vs 3.63%

RBA cash rate

4.35%

Fed funds (mid)

3.63%

Differential

+0.72%

Carry favours

AUD

RBA at 4.35% versus Fed funds near 3.63% in June 2026; Australia holds a narrow positive rate differential.

Sources: Reserve Bank of Australia; US Federal Reserve (FOMC). Fed funds shown as target-range mid-point. A positive differential means Australian rates sit above US rates, supporting AUD carry; a narrowing differential erodes it. Hover or tap to scrub the timeline.

(function(){ function draw(){ if (typeof Chart === ‚undefined‘) { setTimeout(draw, 200); return; } var rbaCol = ‚#185fa5‘; var fedCol = ‚#d85a30‘; var diffCol = ‚#0f6e56‘; var grid = ‚rgba(0,0,0,0.06)‘; var tick = ‚rgba(0,0,0,0.55)‘; var zeroLine = ‚rgba(0,0,0,0.25)‘; var rows = [ {m:’Jun 2023′, rba:4.10, fed:5.125}, {m:’Jul 2023′, rba:4.10, fed:5.375}, {m:’Aug 2023′, rba:4.10, fed:5.375}, {m:’Sep 2023′, rba:4.10, fed:5.375}, {m:’Oct 2023′, rba:4.10, fed:5.375}, {m:’Nov 2023′, rba:4.35, fed:5.375}, {m:’Dec 2023′, rba:4.35, fed:5.375}, {m:’Jan 2024′, rba:4.35, fed:5.375}, {m:’Feb 2024′, rba:4.35, fed:5.375}, {m:’Mar 2024′, rba:4.35, fed:5.375}, {m:’Apr 2024′, rba:4.35, fed:5.375}, {m:’May 2024′, rba:4.35, fed:5.375}, {m:’Jun 2024′, rba:4.35, fed:5.375}, {m:’Jul 2024′, rba:4.35, fed:5.375}, {m:’Aug 2024′, rba:4.35, fed:5.375}, {m:’Sep 2024′, rba:4.35, fed:4.875}, {m:’Oct 2024′, rba:4.35, fed:4.875}, {m:’Nov 2024′, rba:4.35, fed:4.625}, {m:’Dec 2024′, rba:4.10, fed:4.375}, {m:’Jan 2025′, rba:4.10, fed:4.375}, {m:’Feb 2025′, rba:3.85, fed:4.375}, {m:’Mar 2025′, rba:3.85, fed:4.375}, {m:’Apr 2025′, rba:3.85, fed:4.375}, {m:’May 2025′, rba:3.60, fed:4.375}, {m:’Jun 2025′, rba:3.60, fed:4.375}, {m:’Jul 2025′, rba:3.60, fed:4.125}, {m:’Aug 2025′, rba:3.60, fed:4.125}, {m:’Sep 2025′, rba:3.60, fed:3.875}, {m:’Oct 2025′, rba:3.60, fed:3.875}, {m:’Nov 2025′, rba:3.60, fed:3.625}, {m:’Dec 2025′, rba:3.60, fed:3.625}, {m:’Jan 2026′, rba:3.60, fed:3.625}, {m:’Feb 2026′, rba:3.85, fed:3.625}, {m:’Mar 2026′, rba:4.10, fed:3.625}, {m:’Apr 2026′, rba:4.10, fed:3.625}, {m:’May 2026′, rba:4.35, fed:3.625}, {m:’Jun 2026′, rba:4.35, fed:3.625} ]; var labels = rows.map(function(d){ return d.m; }); var rba = rows.map(function(d){ return d.rba; }); var fed = rows.map(function(d){ return d.fed; }); var diff = rows.map(function(d){ return +(d.rba – d.fed).toFixed(3); }); var valEl = document.getElementById(‚div-hover-val‘); var dateEl = document.getElementById(‚div-hover-date‘); var legendEl = document.getElementById(‚div-legend‘); var xCfg = { ticks: { color: tick, font: { size: 11 }, maxRotation: 45, autoSkip: true, maxTicksLimit: 10, callback: function(val, i){ var l = labels[i]; return (l && (l.indexOf(‚Jan‘)===0 || l.indexOf(‚Jul‘)===0)) || i===0 || i===labels.length-1 ? l : “; } }, grid: { display: false } }; var ctx = document.getElementById(‚divChart‘); var chart; function ratesView(){ legendEl.innerHTML = ‚RBA cash rate‚ + ‚Fed funds (mid-point)‚; return { type:’line‘, data:{ labels:labels, datasets:[ { label:’RBA‘, data:rba, borderColor:rbaCol, backgroundColor:’transparent‘, borderWidth:2.5, stepped:true, pointRadius:0, pointHoverRadius:4, pointBackgroundColor:rbaCol }, { label:’Fed‘, data:fed, borderColor:fedCol, backgroundColor:’transparent‘, borderWidth:2.5, borderDash:[6,4], stepped:true, pointRadius:0, pointHoverRadius:4, pointBackgroundColor:fedCol } ]}, options: baseOpts(false) }; } function diffView(){ legendEl.innerHTML = ‚AUD − USD rate differential‚ + ‚Above zero = Australian rates higher (AUD carry advantage)‚; return { type:’line‘, data:{ labels:labels, datasets:[ { label:’Differential‘, data:diff, borderColor:diffCol, backgroundColor:’rgba(15,110,86,0.10)‘, borderWidth:2.5, fill:true, stepped:true, pointRadius:0, pointHoverRadius:4, pointBackgroundColor:diffCol } ]}, options: baseOpts(true) }; } function baseOpts(isDiff){ return { responsive:true, maintainAspectRatio:false, interaction:{ mode:’index‘, intersect:false }, onHover:function(e, els){ if(els && els.length){ var i = els[0].index; dateEl.textContent = labels[i]; if(isDiff){ var sign = diff[i] >= 0 ? ‚+‘ : “; valEl.innerHTML = ‚‚ + sign + diff[i].toFixed(2) + ‚%‚; } else { valEl.innerHTML = ‚‚ + rba[i].toFixed(2) + ‚% vs ‚ + fed[i].toFixed(2) + ‚%‚; } } }, plugins:{ legend:{ display:false }, tooltip:{ backgroundColor:’#ffffff‘, titleColor:’#2c2c2a‘, bodyColor:’#2c2c2a‘, borderColor:’rgba(0,0,0,0.12)‘, borderWidth:1, padding:10, callbacks:{ title:function(items){ return items[0].label; }, label:function(item){ if(isDiff){ var v = item.parsed.y; var s = v>=0?’+‘:“; return ‚AUD-USD differential: ‚ + s + v.toFixed(2) + ‚%‘; } return item.dataset.label + ‚: ‚ + item.parsed.y.toFixed(2) + ‚%‘; } } } }, scales:{ y: isDiff ? { min:-2, max:1.5, ticks:{ color:tick, callback:function(v){ return (v>=0?’+‘:“) + v.toFixed(1) + ‚%‘; }, font:{size:11} }, grid:{ color:function(c){ return c.tick.value===0 ? zeroLine : grid; } } } : { min:3.0, max:5.75, ticks:{ color:tick, callback:function(v){ return v.toFixed(1) + ‚%‘; }, font:{size:11} }, grid:{ color:grid } }, x: xCfg } }; } function render(view){ if(chart) chart.destroy(); var cfg = view===’diff‘ ? diffView() : ratesView(); chart = new Chart(ctx, cfg); } var bRates = document.getElementById(‚btn-rates‘); var bDiff = document.getElementById(‚btn-diff‘); function setActive(active, inactive){ active.style.background = ‚#ffffff‘; active.style.color = ‚#2c2c2a‘; active.style.boxShadow = ‚0 1px 2px rgba(0,0,0,0.06)‘; inactive.style.background = ‚transparent‘; inactive.style.color = ‚#5f5e5a‘; inactive.style.boxShadow = ’none‘; } bRates.addEventListener(‚click‘, function(){ setActive(bRates, bDiff); render(‚rates‘); }); bDiff.addEventListener(‚click‘, function(){ setActive(bDiff, bRates); render(‚diff‘); }); render(‚rates‘); } draw(); })();

Haftungsausschluss: Nur zu Bildungszwecken. Trading ist mit erheblichen Risiken verbunden, die zum Verlust Ihres Kapitals führen können. Trader sollten vor dem Investieren ihre eigene Sorgfaltsprüfung durchführen.

Teilen

Beginnen Sie zu investieren noch heute mit Alchemy Markets

Jetzt loslegen