


Verfasst von:


- Elliott Wave
- Juni 16, 2026
- 2 Min. Lesezeit
Silver Prices Reclaim 200 SMA [XAGUSD Elliott Wave]
Executive Summary
- Silver prices (XAGUSD) declined about 31% in the past month to last week’s low.
- A descending triangle may be developing and the current rally could be the last leg of the triangle.
- 200 Day Simple Moving Average was reclaimed yesterday on the rally above $68.58.
For the past month, silver has been falling in a downtrend with weak rallies until the June 11 low of $61.50. From that low, it appears Silver prices are rallying in the last leg of a 6-month long triangle pattern.
Current Elliott Wave Analysis
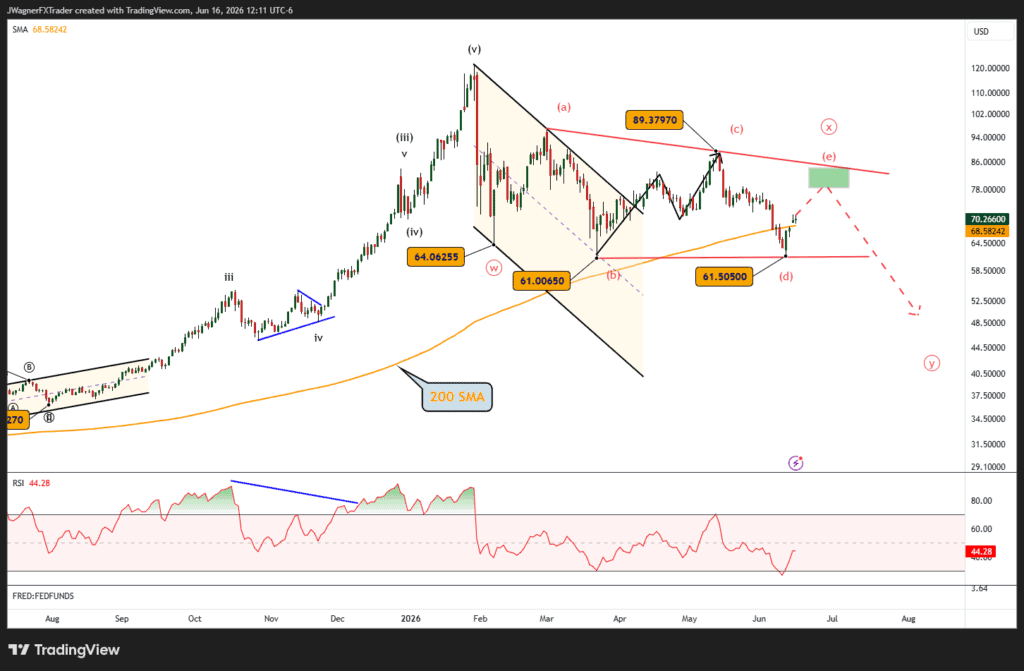
Silver (XAGUSD) prices have been grinding sideways in a large range since the January 29 high. It appears Silver is developing a bearish double zigzag pattern labeled ((w))-((x))-((y)).
Within Elliott Wave Theory, it is common for wave ((x)) to be a triangle pattern. In this case, it appears to be carving a descending triangle where the two lows are close in price.
In this case, wave (b) reached $61.01 and wave (d) reached $61.50. This support shelf appears like a double bottom pattern and is currently holding up prices. However, we are anticipating an eventual breakdown.
There are 5-legs of an Elliott wave triangle pattern labeled (a)-(b)-(c)-(d)-(e). Each of those subwaves takes the shape of a zigzag, multiple zigzag, or triangle pattern. Therefore, since we are anticipating this current rally to be wave (e), we can also anticipate it will take on a zigzag, multiple zigzag, or triangle pattern.
Some upside targets range between $78.25 – $84.60, though silver prices do not have to reach that high to complete the triangle pattern. The topside key level for the bearish triangle is $89.38. Any print above this level voids the triangle pattern as we have it labeled.
Last week, silver prices briefly punched below the 200 day simple moving average. That moving average can act like a value buy zone for long-term investors during this remaining rally higher.
Bottom Line
Silver remains in a larger corrective pattern from its all-time high in January.
Though we are anticipating a rally to $78.25 – $84.60, this rally is viewed as a corrective bounce within a larger decline.
Eventually, we anticipate silver prices may break below $61.01 to complete wave ((y)).
Only on a print above $89.38 can we state the triangle pattern as counted is voided and we’ll consider other alternative counts.


