


Verfasst von:


- Chart of the Day
- Juni 1, 2026
- 3 Min. Lesezeit
XHB: Homebuilders Break Out — And Buffett’s Successor Just Co-Signed the Move
XHB: Homebuilders Pressed Against the Ceiling — And Buffett’s Successor Just Lit the Fuse
Instrument: SPDR S&P Homebuilders ETF (XHB) Price: ~$103.22 (pre-market) | 20-day SMA: $99.77 | 50-day SMA:$102.14
Sometimes a chart and a headline arrive at exactly the same moment. Today, the homebuilders are sitting on the edge of a technical decision — and the most patient money on earth has just shown up to nudge them.
The setup
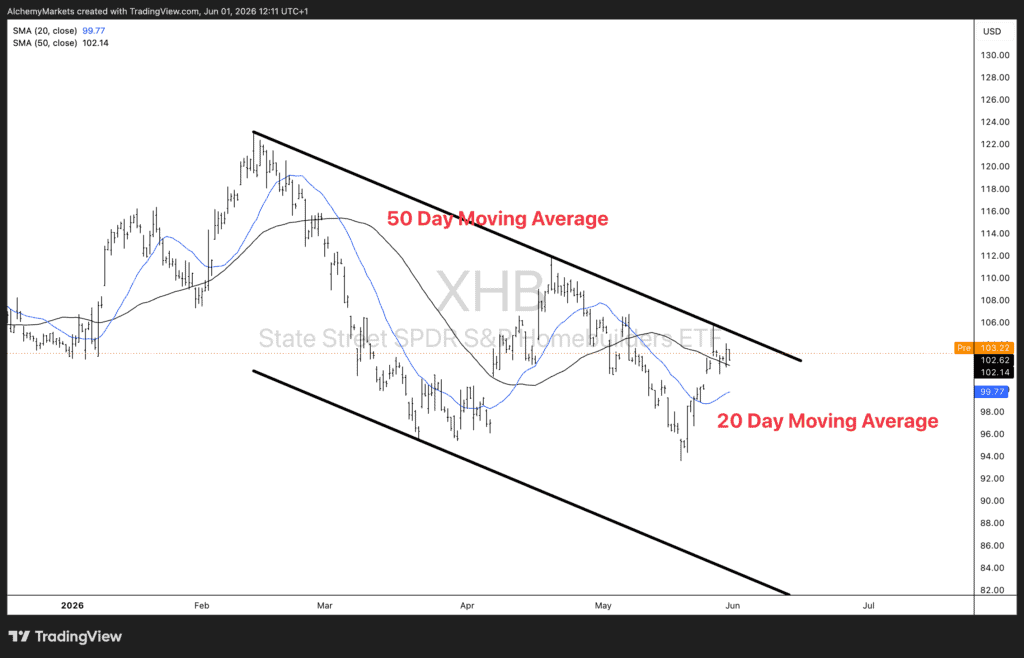
Step back to the daily and the structure is clean: since the February peak near $124, XHB has been carving out a broad descending channel — a months-long sequence of lower highs and lower lows that has defined the entire 2026 downtrend. Every rally has been capped by the upper trendline; every washout has found buyers near the lower rail.
Right now, price is doing something it hasn’t managed all year — it’s pushing right up into the upper boundary of that channel. At $103.22 pre-market, XHB is testing the exact line that has rejected every advance since winter. It has also reclaimed the 50-day moving average ($102.14) and is trading well clear of the 20-day ($99.77), which has flattened and begun to turn higher.
This is the part that matters: the breakout has not happened yet. Price is at the door, not through it. That distinction is everything. A confirmed close above the channel would mark the first genuine break of the 2026 downtrend and unlock real upside. A rejection here — another lower high off the same line — and the bears stay firmly in control.
Where it can go
If buyers force a clean break and hold above the channel, the path opens up quickly. The first objective is the $105–106 zone, where price stalled repeatedly in May, followed by the early-May spike high near $108. A confirmed breakout would also flip the script on the multi-month trend, putting the February-to-now downtrend in question for the first time.
On the flip side, the line in the sand is simple. Failure at the upper boundary, followed by a slip back below the 50-day ($102.14), would signal the channel is still intact and put the 20-day ($99.77) — and potentially the lower rail — back in focus. Until price closes above and holds, this remains a downtrend testing its ceiling, not a breakout.
Why the fundamentals are leaning bullish
Here’s the catalyst that makes this test so interesting. Berkshire Hathaway has just agreed to buy homebuilder Taylor Morrison for $6.8bn in all-cash — a 24% premium that sent the target up more than 22% pre-market. It’s the first major deal under new CEO Greg Abel, and it’s a deliberate, long-horizon bet that the US housing cycle is turning after years of cooling under elevated mortgage rates and squeezed builder margins.
When capital that patient deploys from a ~$380bn cash pile into the sector, it’s a meaningful fundamental tailwind arriving precisely as the chart hits its decision point. Layer on the softer macro backdrop — easing oil prices taking pressure off inflation and a market increasingly debating eventual rate relief — and the conditions for that breakout to confirm are as supportive as they’ve been all year.
The takeaway
XHB is at the edge of breaking its 2026 descending channel, with the 50-day reclaimed and the 20-day curling up. The Berkshire deal hands it a powerful fundamental reason to push through. But the breakout isn’t done until price closes above the channel and holds — that’s the trigger. Confirm it, and $105–106 then $108 come into view. Reject it, and the downtrend lives to fight another day.
The builders are knocking on the door. Now we find out if it opens.


