Verfasst von:

- Chart of the Day
- September 1, 2026
- 5 Min. Lesezeit
US 10-Year Yields Hit 2025 Highs after Warsh’s Jackson Hole Speech
US 10-year yields have pushed back into the 4.75% to 4.80% region, around their highest level since January 2025.
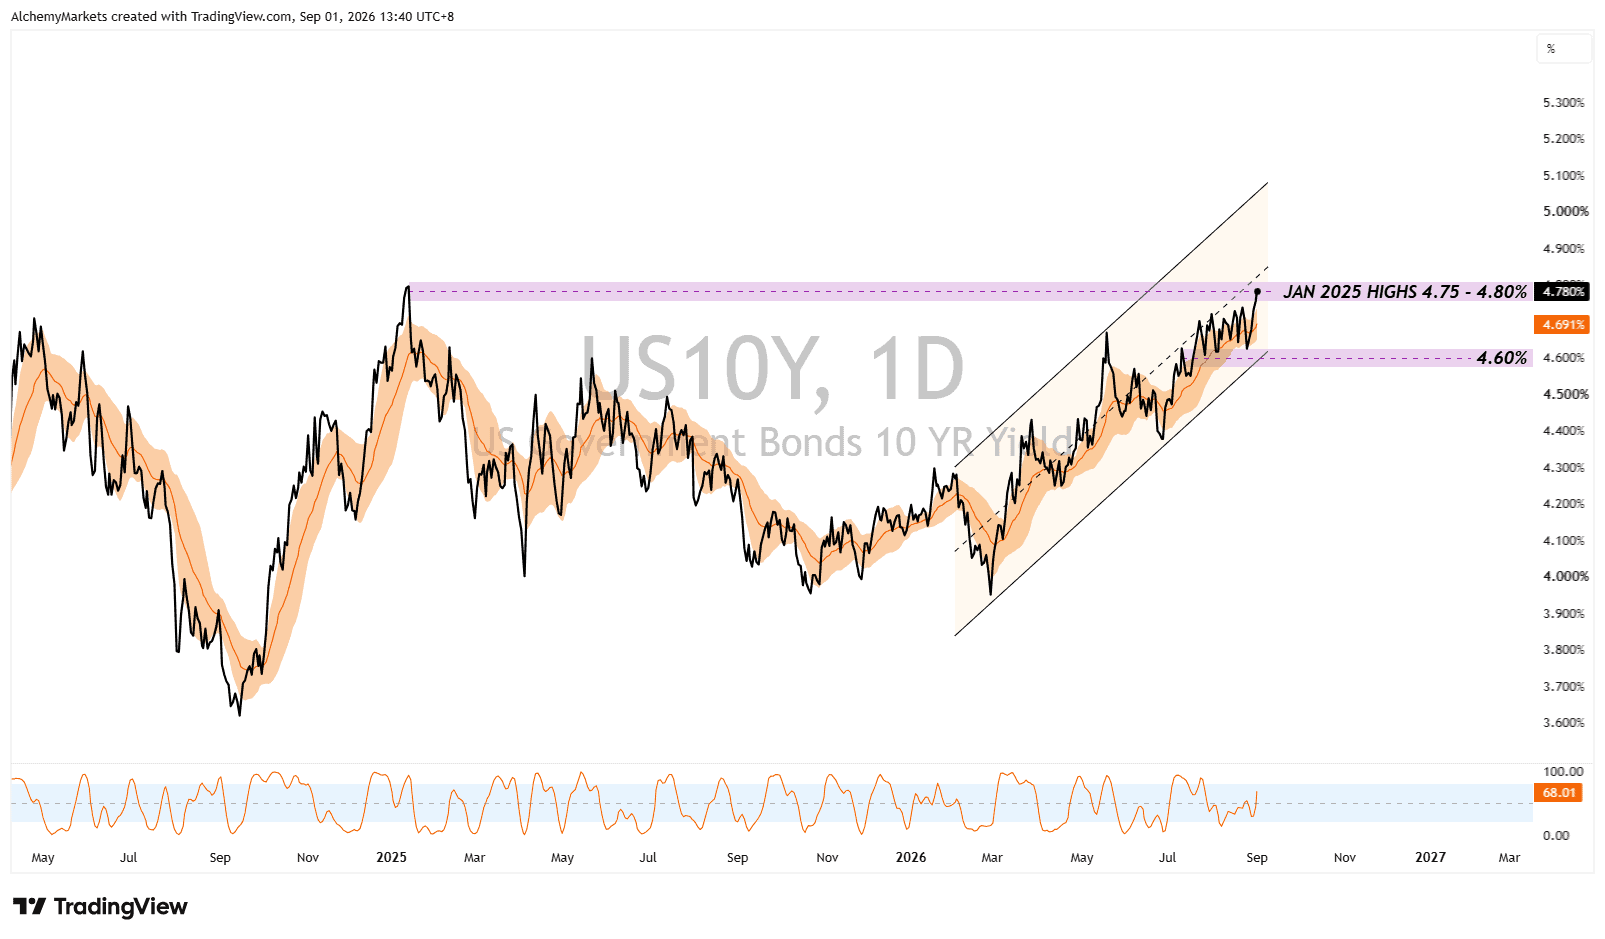
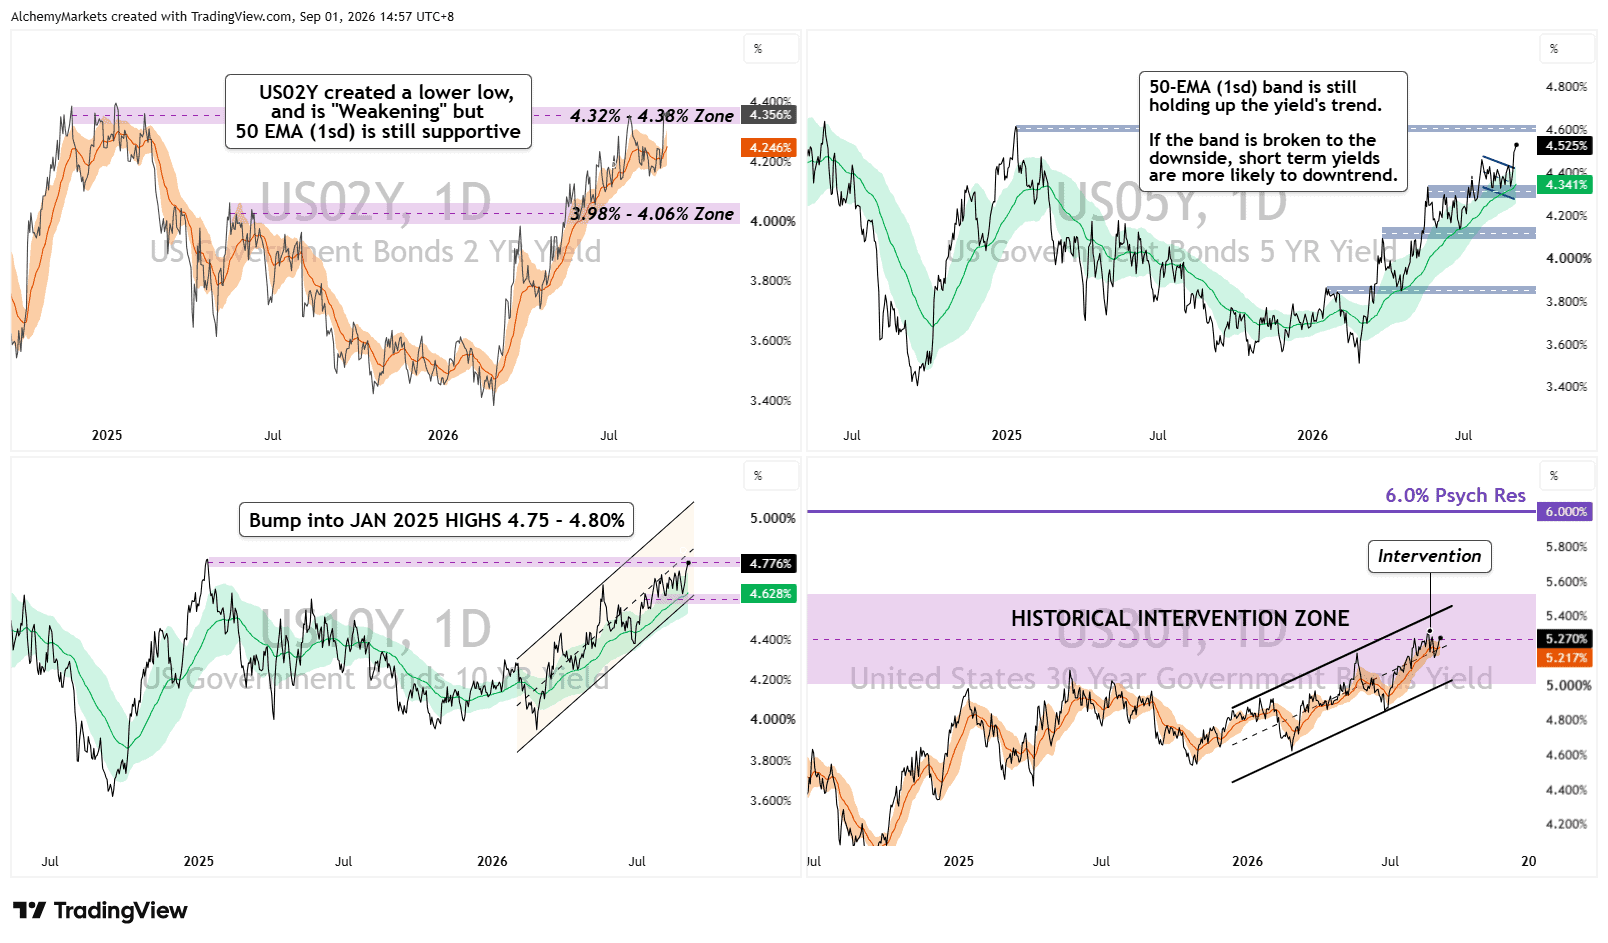
This is not insignificant as it coincides with US 2-year, 5-year, and 30-year yields all rising at the same time.
There are two obvious triggers.
First, the US and Iran exchanged direct fire again at the end of August. US forces struck two Iranian launchers on Larak Island, while Iran later fired on US positions in Jordan. Oil and inflation risk came straight back into the rates conversation.
Then came Kevin Warsh.
His first Jackson Hole as Fed Chair was more hawkish than markets expected. He did not promise a September hike, but he called the Fed’s 2% PCE target “firm” and “fixed” and made clear that inflation is still too high.
That quickly pulled the front end higher. At the same time, the US Treasury is increasing the maximum size of long-end liquidity support buybacks from $2 billion to at least $4 billion per operation between September 9 and November 4.
Treasury is trying to keep the long end orderly while Warsh is signalling that markets should not expect easier monetary policy whenever financial conditions tighten.
Fed Merry-Go-Round Is Back
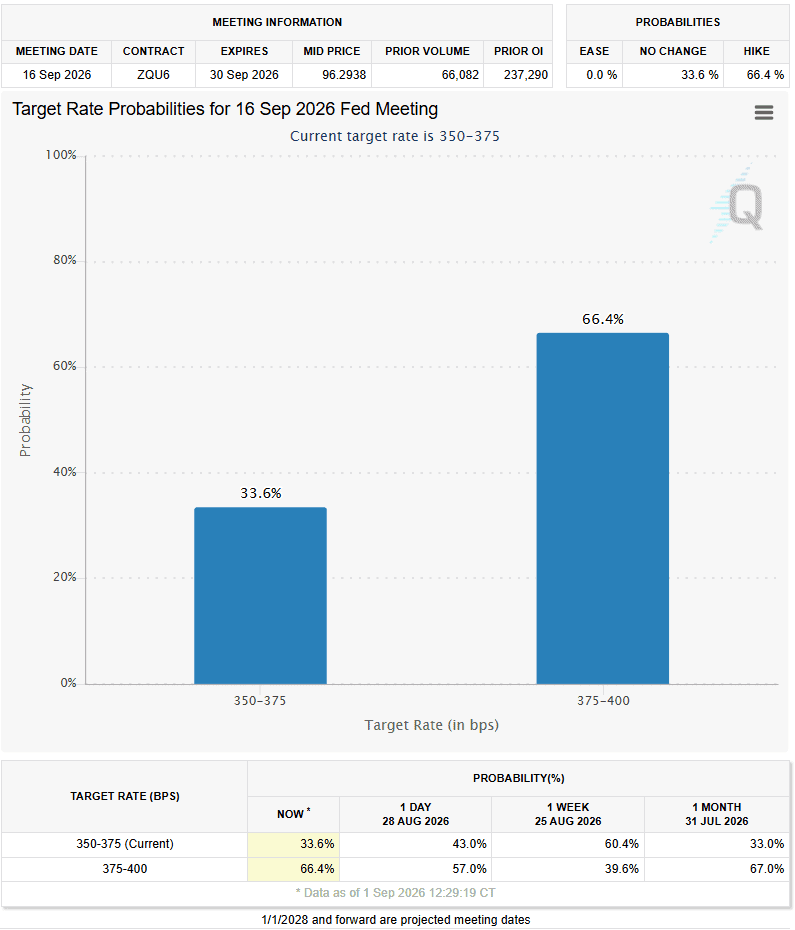
As a result, market participants are now flip-flopping on the upcoming Interest Rate Decision again.
The probability of a hold has fallen from 43% to 33.6% in a day, leaving a 66.4% probability of a hike in our September 1 FedWatch capture.
One week earlier, the market had been pricing a 60.4% chance of a hold. One month earlier, it was back near 33%.
We have basically boarded a merry-go-round, and Warsh, oil and the bond market have taken us for a spin.
Bond Selloff Is Not Just in the US
If US yields were moving on their own, it would be easy to attribute it to Jackson Hole and stop there.
But government bond yields are rising across several major markets at the same time.
Japan’s 10-year JGB has touched 3% for the first time since 1996. Germany’s 10-year yield is at its highest since 2011, while long-end yields in France and Germany are around 15-year highs.
Higher oil is keeping inflation pressure alive, while heavier bond issuance and a higher term premium are also pushing long-term yields up.
Japan’s 3% Yield Changes the Foreign-Bond Trade
For years, Japan was one of the anchors of the global bond market.
Domestic yields were so low that Japanese investors had a strong reason to own Treasuries, European bonds and other overseas assets instead.
A 3% Japanese 10-year yield changes that calculation.
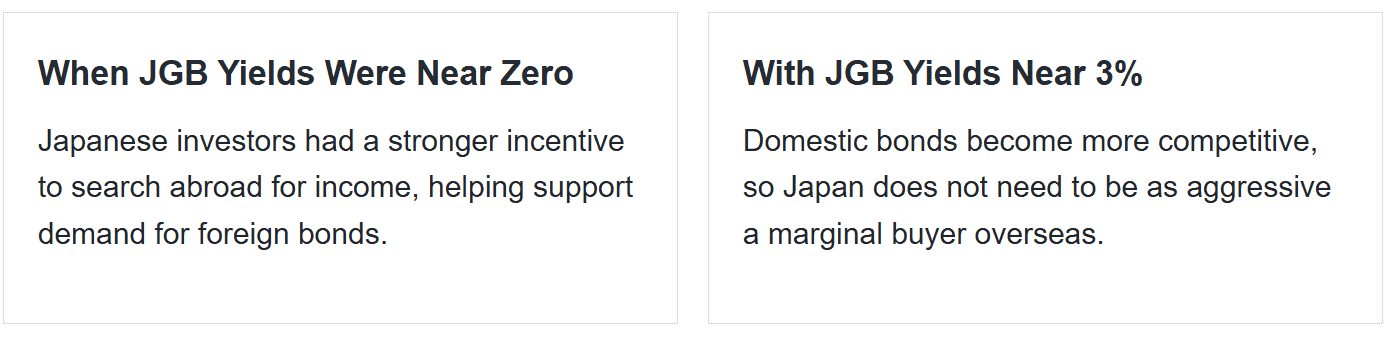
This does not require Japanese investors to suddenly dump their Treasury holdings.
Simply, they may just buy fewer foreign bonds at the margin. When sovereign and corporate issuance is already heavy, losing even part of that incremental demand can push term premium higher in the US and Europe.
Could Warsh Tighten Without Actually Hiking?
Warsh finished Jackson Hole by saying he was committed to a “discipline, not to a decision.”
He also argued that regular forward guidance has overstayed its welcome.
If Warsh can push hike probabilities communication alone, financial conditions can tighten before the FOMC changes the policy rate.
| How the Market Can Tighten Before the Fed A more hawkish Fed can push front-end yields higher, strengthen the dollar and tighten borrowing conditions before the policy rate itself changes. If markets do enough of that work on their own, the Fed may not need to deliver all of the tightening immediately. |
There is also a risky scenario to be wary of.
If oil and inflation stay hot and the Fed holds anyway, investors may decide policy is falling behind the curve. The 2-year could ease while the long end sells off harder.
So after September 16, watch which part of the curve leads. A front-end-led move says markets are worried about the Fed. A long-end-led move points more towards inflation, debt supply and term premium.
So What Asset Should We Pay Attention to Now?
That brings us back to our Gold vs US 2-year minus 30-year yield spread.
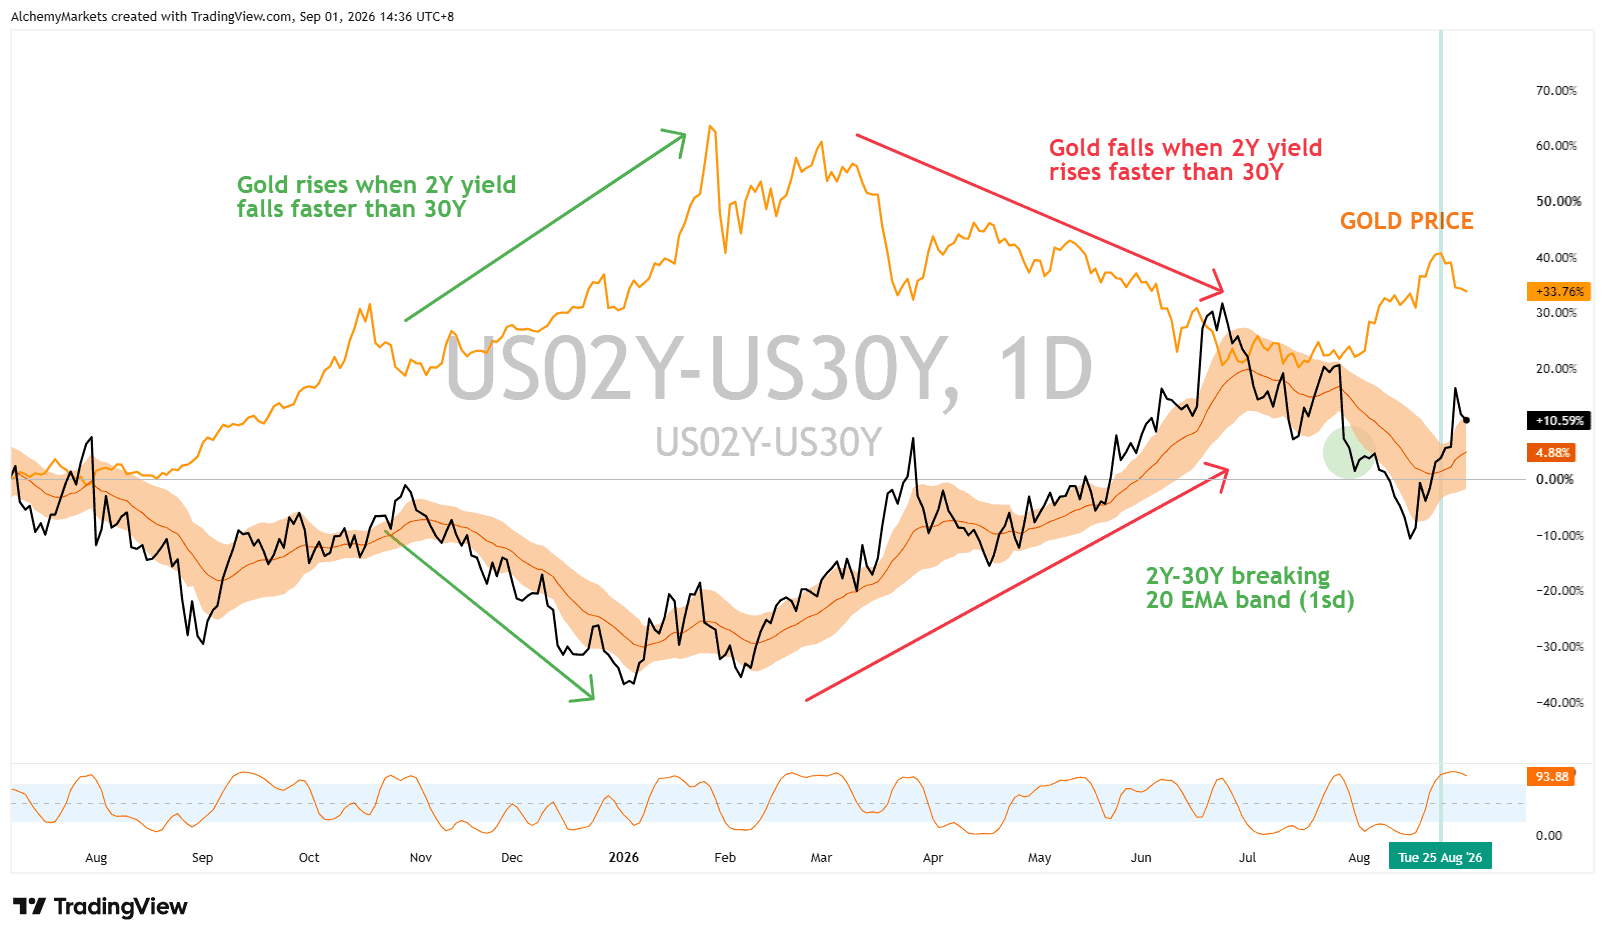
We previously used this spread as a simple read on Fed pressure. The chart uses a Bollinger Band around a 20-day exponential moving average (EMA).
When the 2-year holds up better than the 30-year, the spread rises. That usually reflects more pressure on the Fed-sensitive front end and has recently been uncomfortable for gold.
In late July, the spread broke below the band and was rejected on the retest. Gold moved higher. By the final week of August, the spread had broken back above the band and gold began to fall.
If the spread now holds above the EMA band, the near-term rates backdrop remains difficult for gold.
If the Fed holds and the 2-year falls faster than the 30-year, the spread can roll back below the band and revive the July setup. Gold could also strengthen if the long end becomes the problem and the 30-year rises faster instead.
September 16 is the next major test. The key is not only whether Warsh hikes or holds, but whether the next bond move comes from the Fed-sensitive front end or from the long end.