


Verfasst von:


- Chart of the Day
- März 14, 2025
- 1 Min. Lesezeit
EURUSD and EXY Rejects from Weekly EMA 200 and Rising Trendline
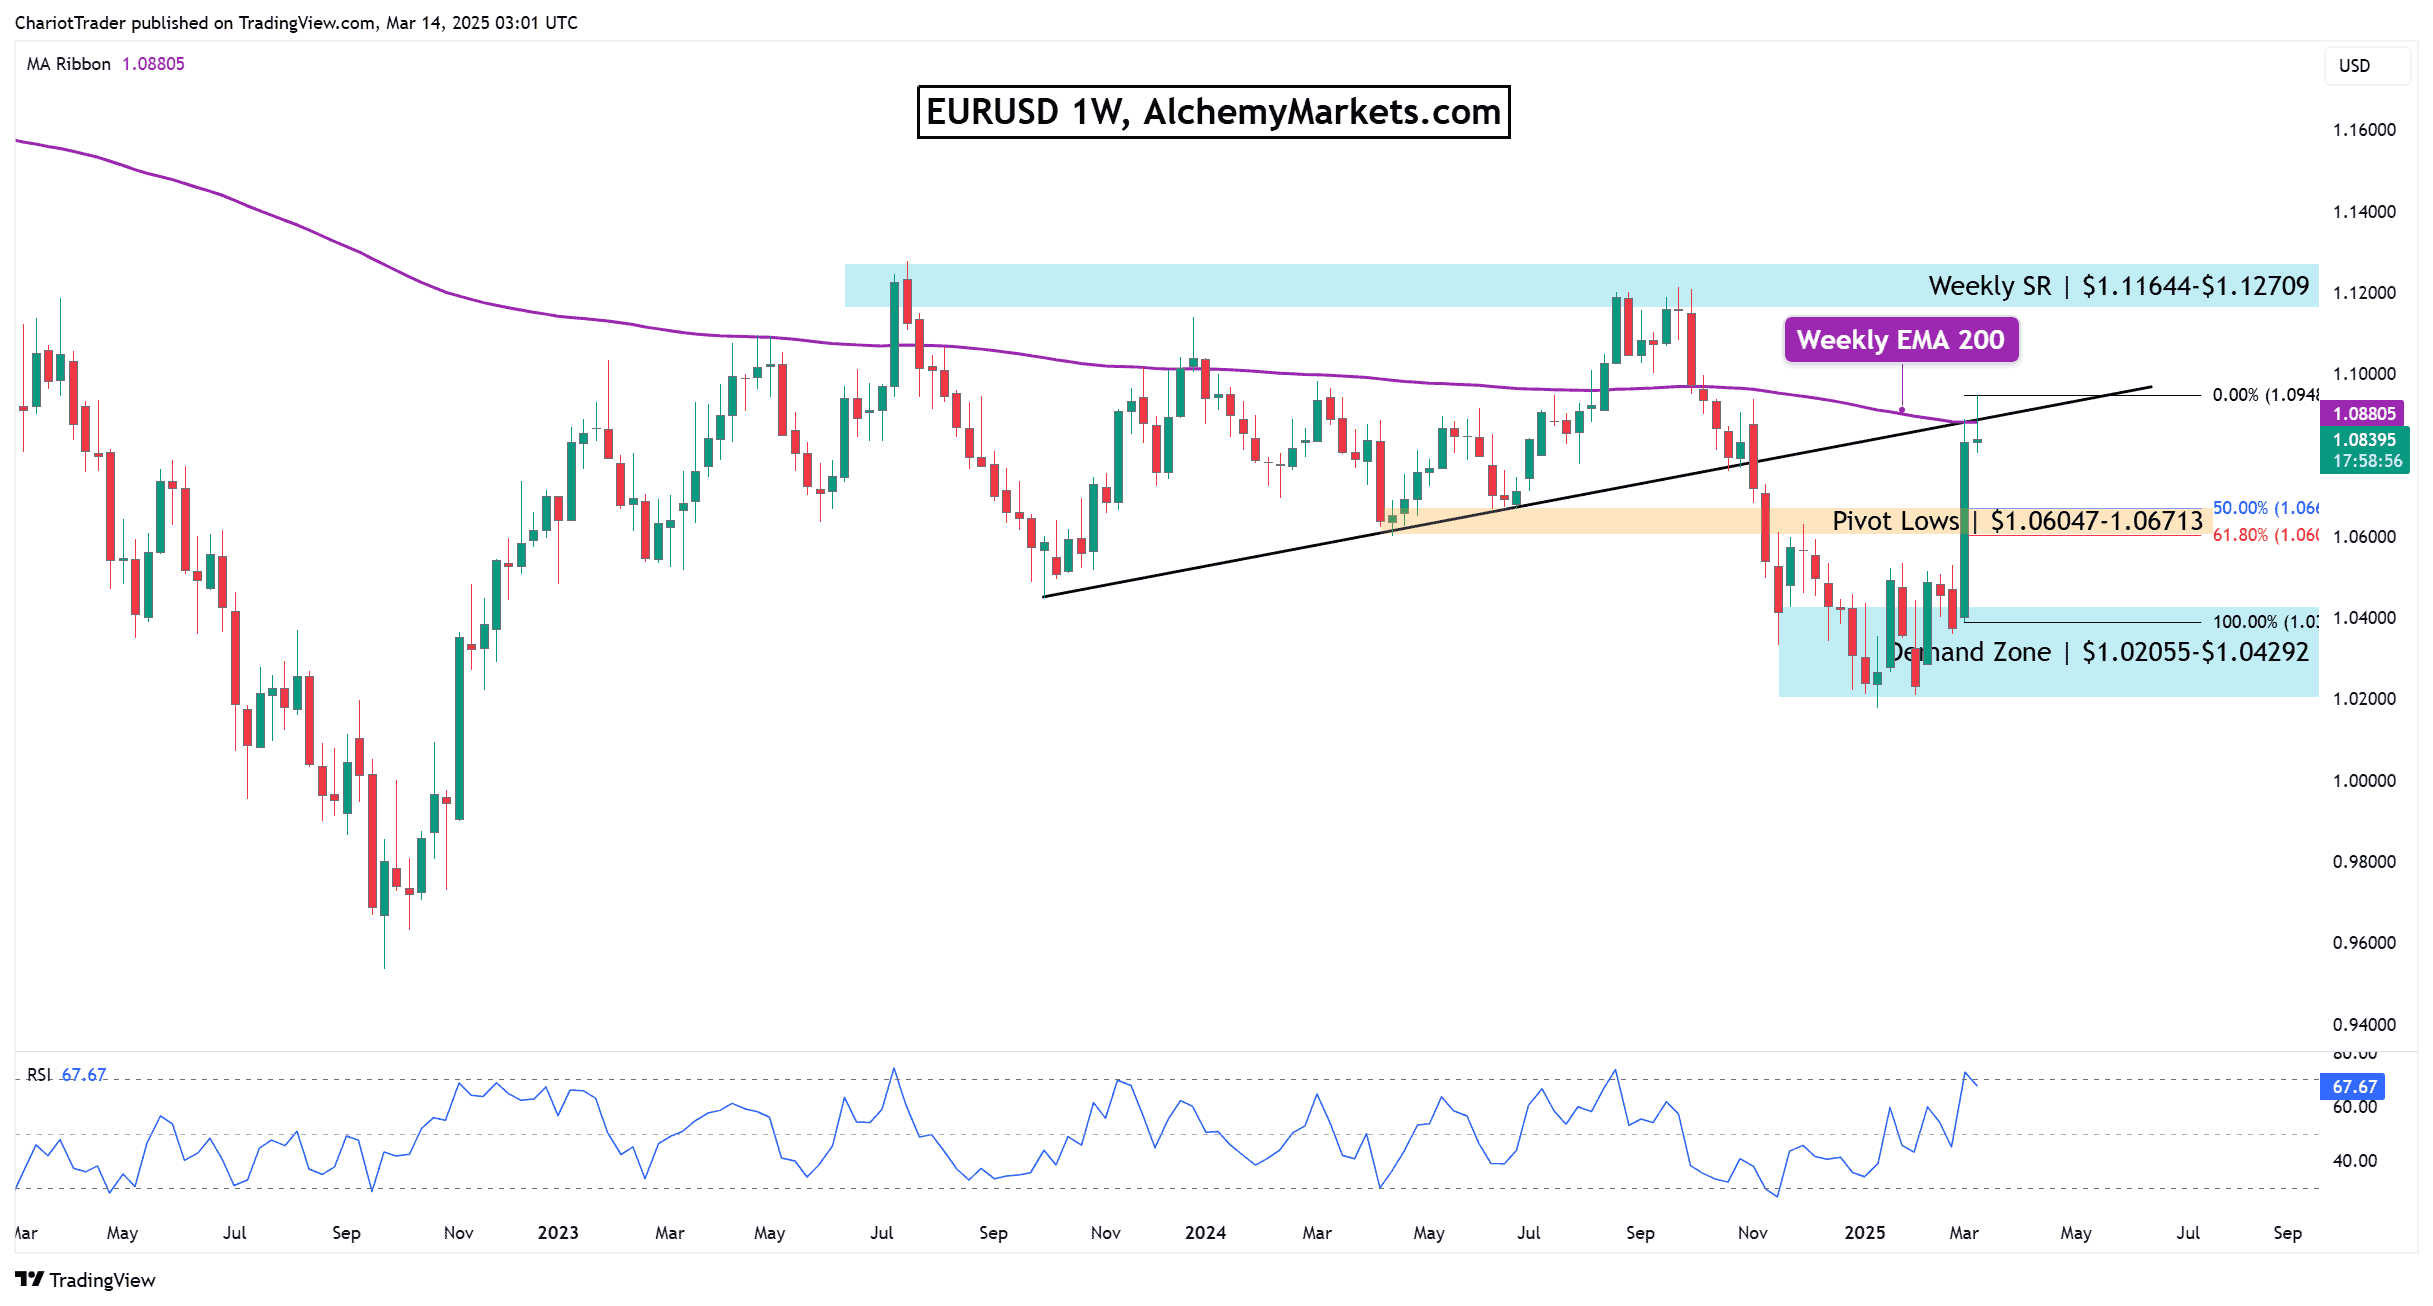
After a powerful, ‘straight-line-up’ rise from $1.038 to $1.095, the Euro-Dollar pair has finally seen a rejection at the Weekly EMA-200, and a rising weekly trendline.
This rejection comes in perfect alignment with the EXY (Euro Strength Index), which also has seen an identical rejection. The question now becomes—is the EURUSD likely to see a retracement now? And where would a retracement stop?
EUR/USD Chart Analysis
Currently, the EUR/USD has seen a steep rise from $1.038 and pushed into overbought territories on the RSI.
- Daily RSI: 75.90
- Weekly RSI: 72.69
There is no bearish divergence, so even though a retracement could happen (Due to critical resistance), it may not be as severe.
If a retracement does occur, watch these levels:
- Pivot lows between $1.06047–$1.06713, aligns with the 50% and 61.80% Fibonacci retracement
- Demand zone between $1.02066–$1.04292, approximately.
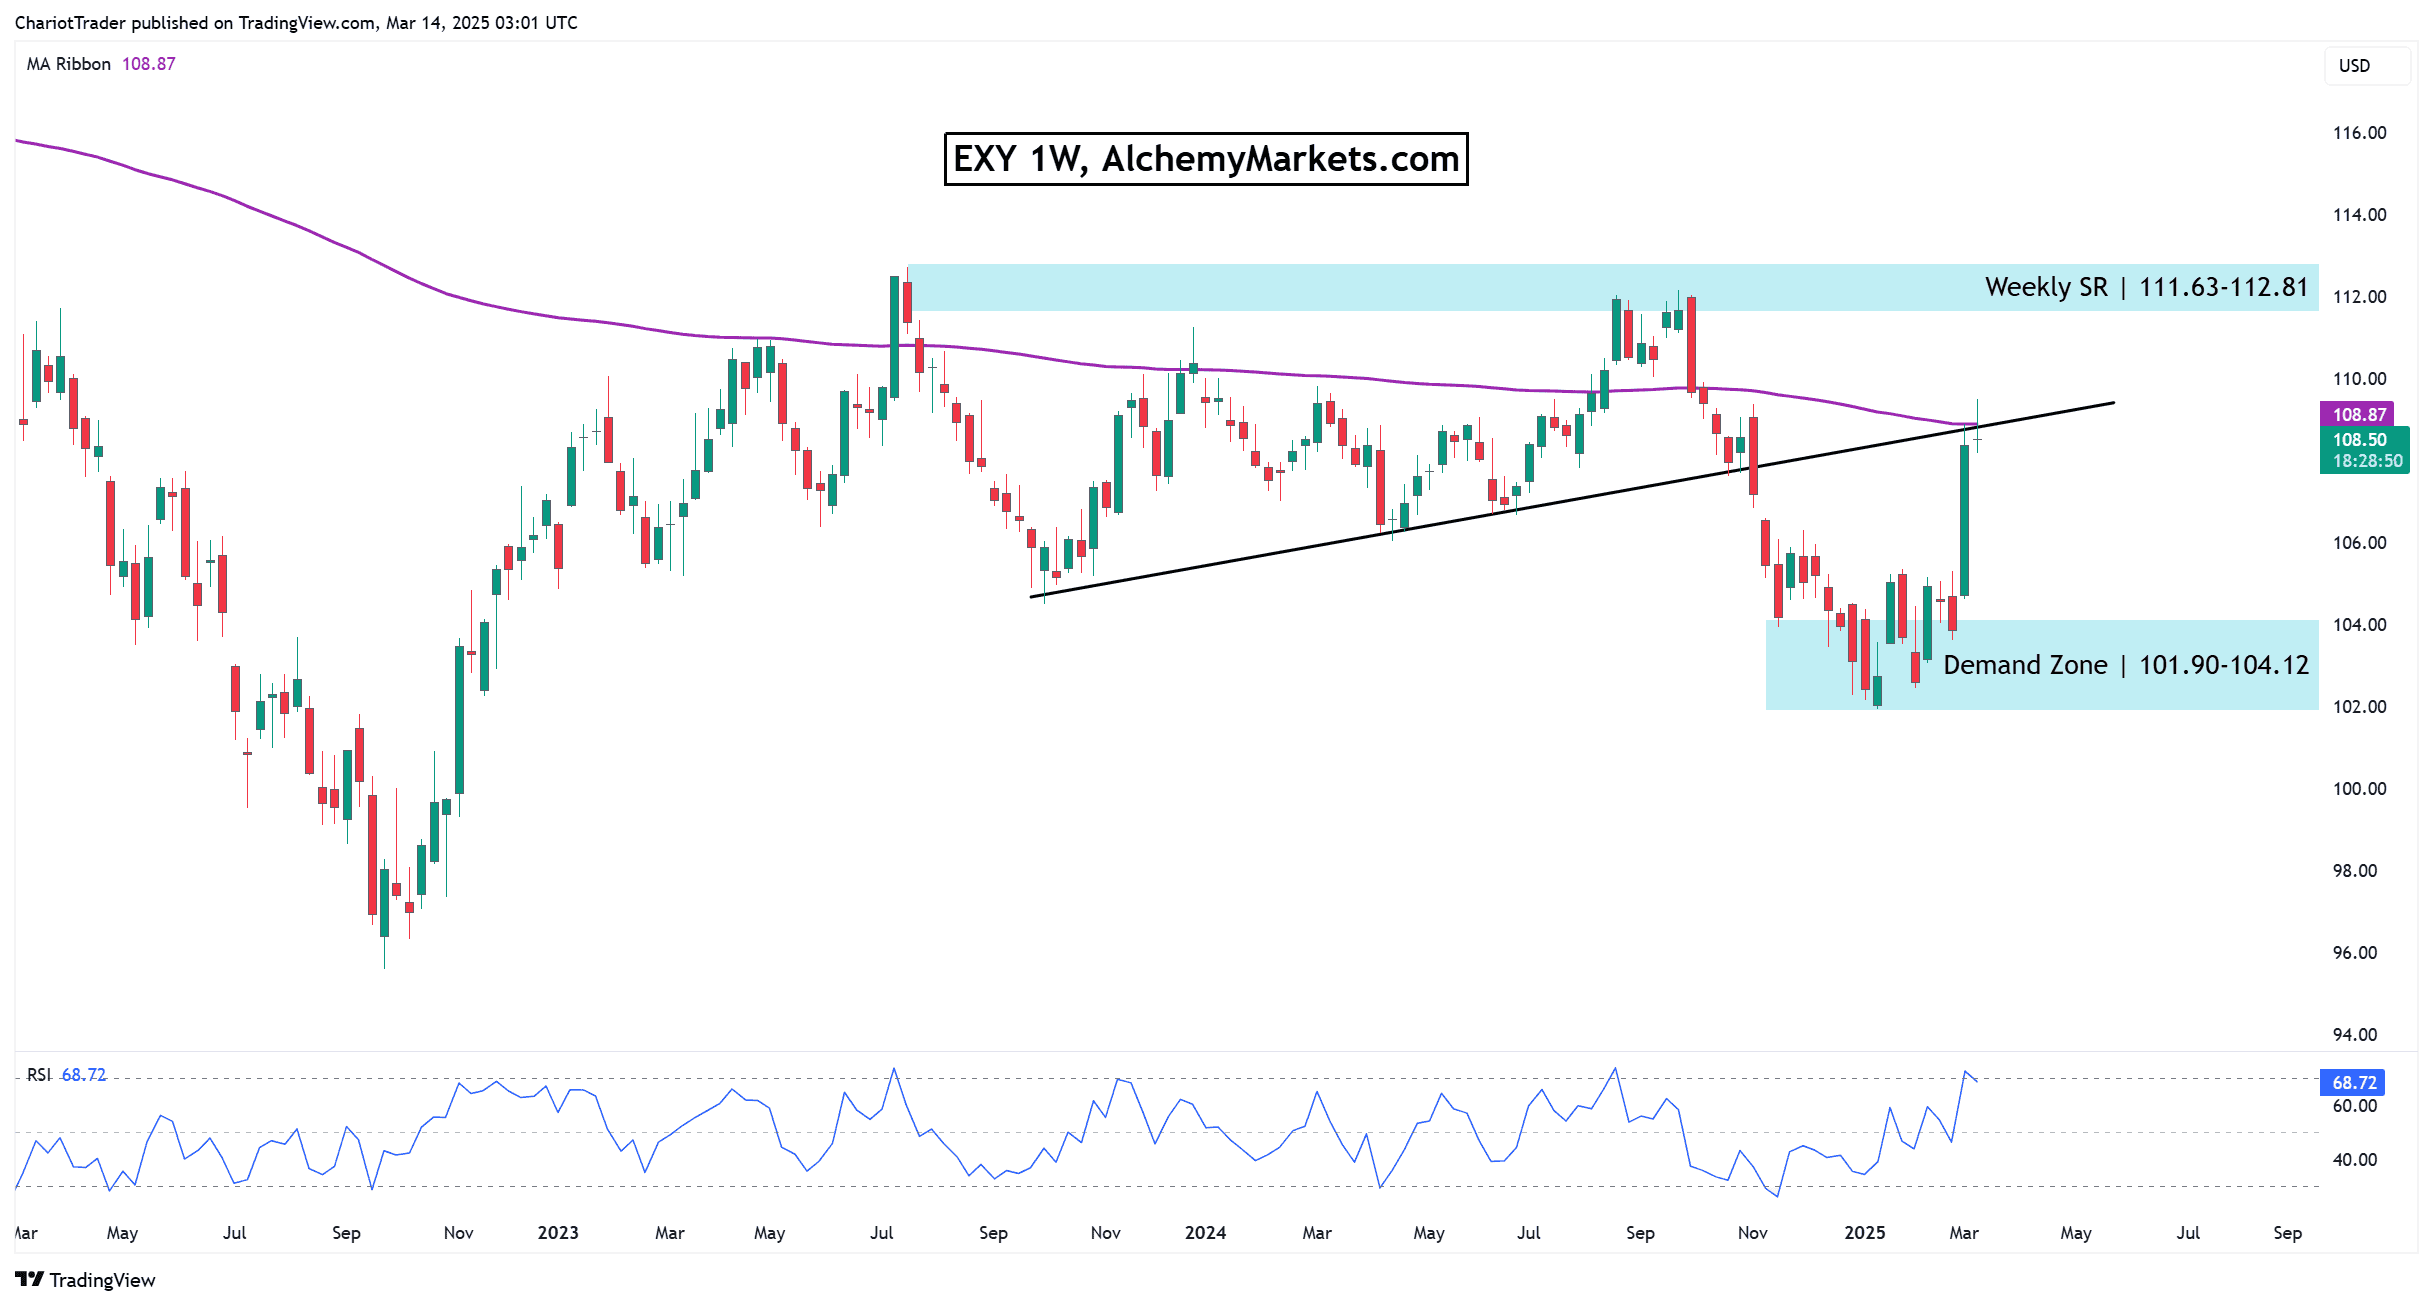
EXY Chart Analysis
The EXY Chart is drawing a nearly identical shape to the EURUSD asset, rejecting off the Weekly EMA-200, rising trendline with no bearish divergence. Similarly, the EXY may find support at its demand zone, or even above that at its previous lows.
You may also be interested in:


