USDT Dominance has spiked into the 5.80% range, reflecting the run to safety within the crypto market. Bitcoin is down -5.6% for the week, and crypto assets across the board have fallen.
‘S’ coins such as DOGE taking the largest hits (-19.3%), and the announced crypto reserve altcoins: Ethereum, Solana, XRP, DOT, and Cardano have all declined by roughly -10%.
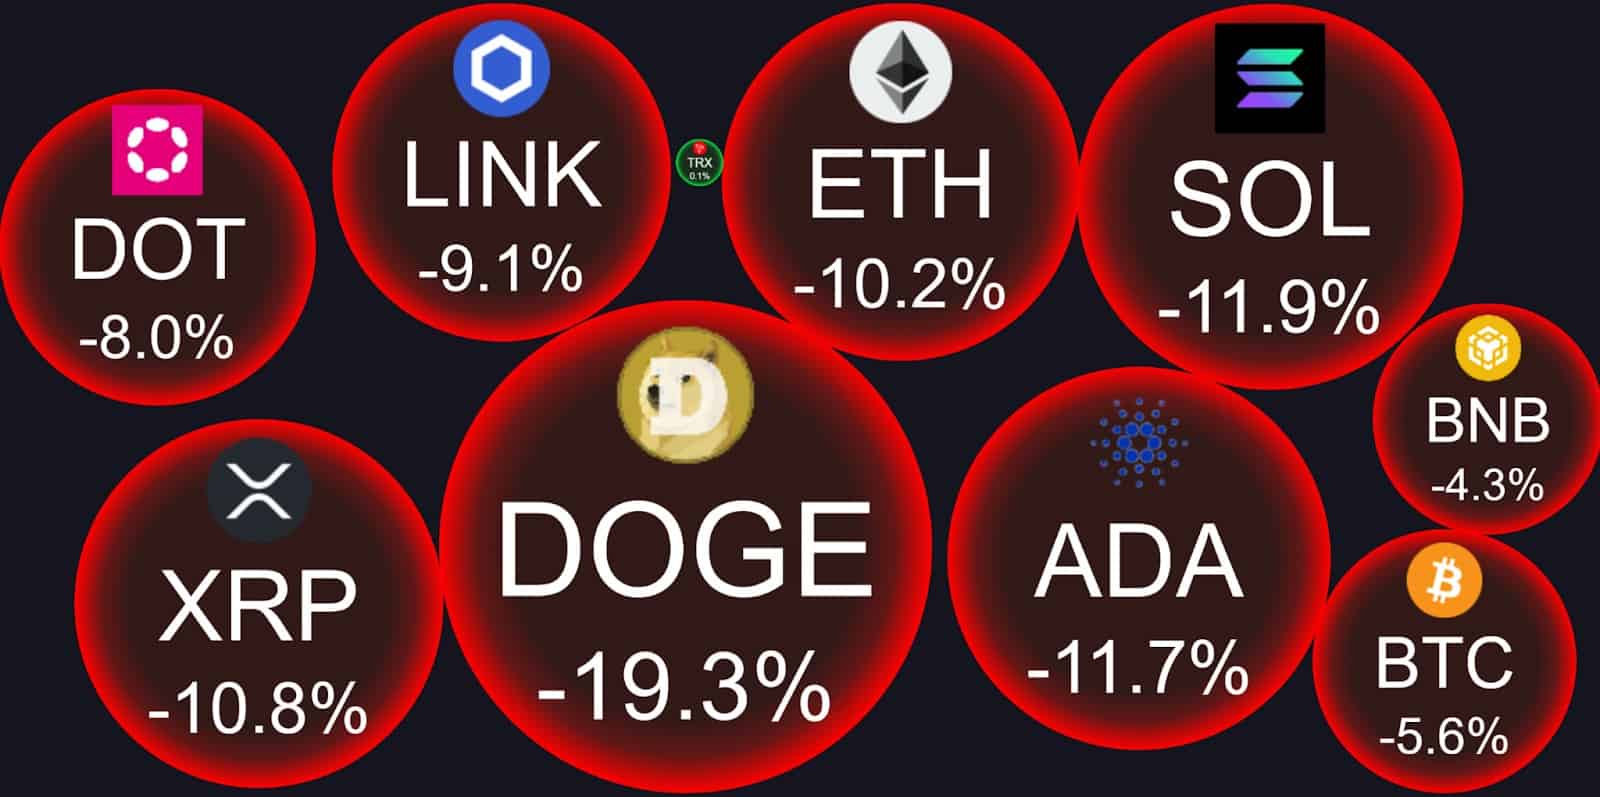
Source: Coin Bubble
This decline came with the announcement of the US Crypto Reserves, Trump’s tariffs on Mexico and Canada, as well as ongoing peace talks with Russia-Ukraine. Investors may be feeling uncertain due to the erratic developments of geopolitical news, explaining the run to safety.
Gauge Market Health with USDT.D Chart
The USDT Dominance chart moves inversely to Bitcoin and the overall crypto market, making it a useful tool for gauging potential market recoveries. When plotted alongside BTCUSDT, the correlation becomes clear—USDT.D rises when Bitcoin falls and vice versa.
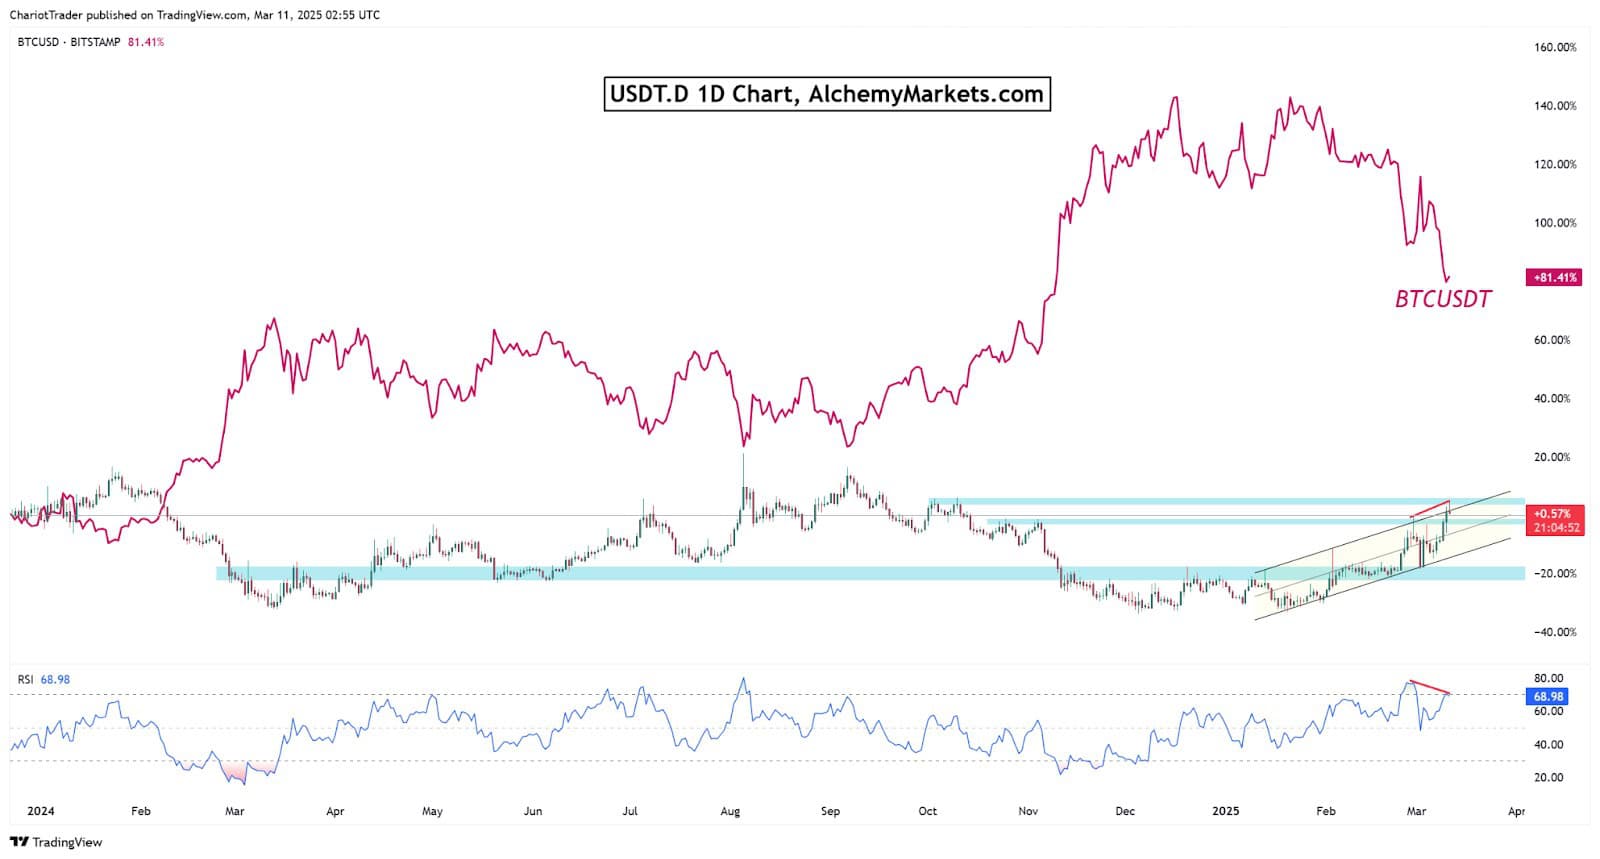
Bulls will need a pullback on USDT.D in order to see the crypto market reverse, and currently, there are signs for a reversal brewing.
Brewing Signs of a Pullback on USDT.D
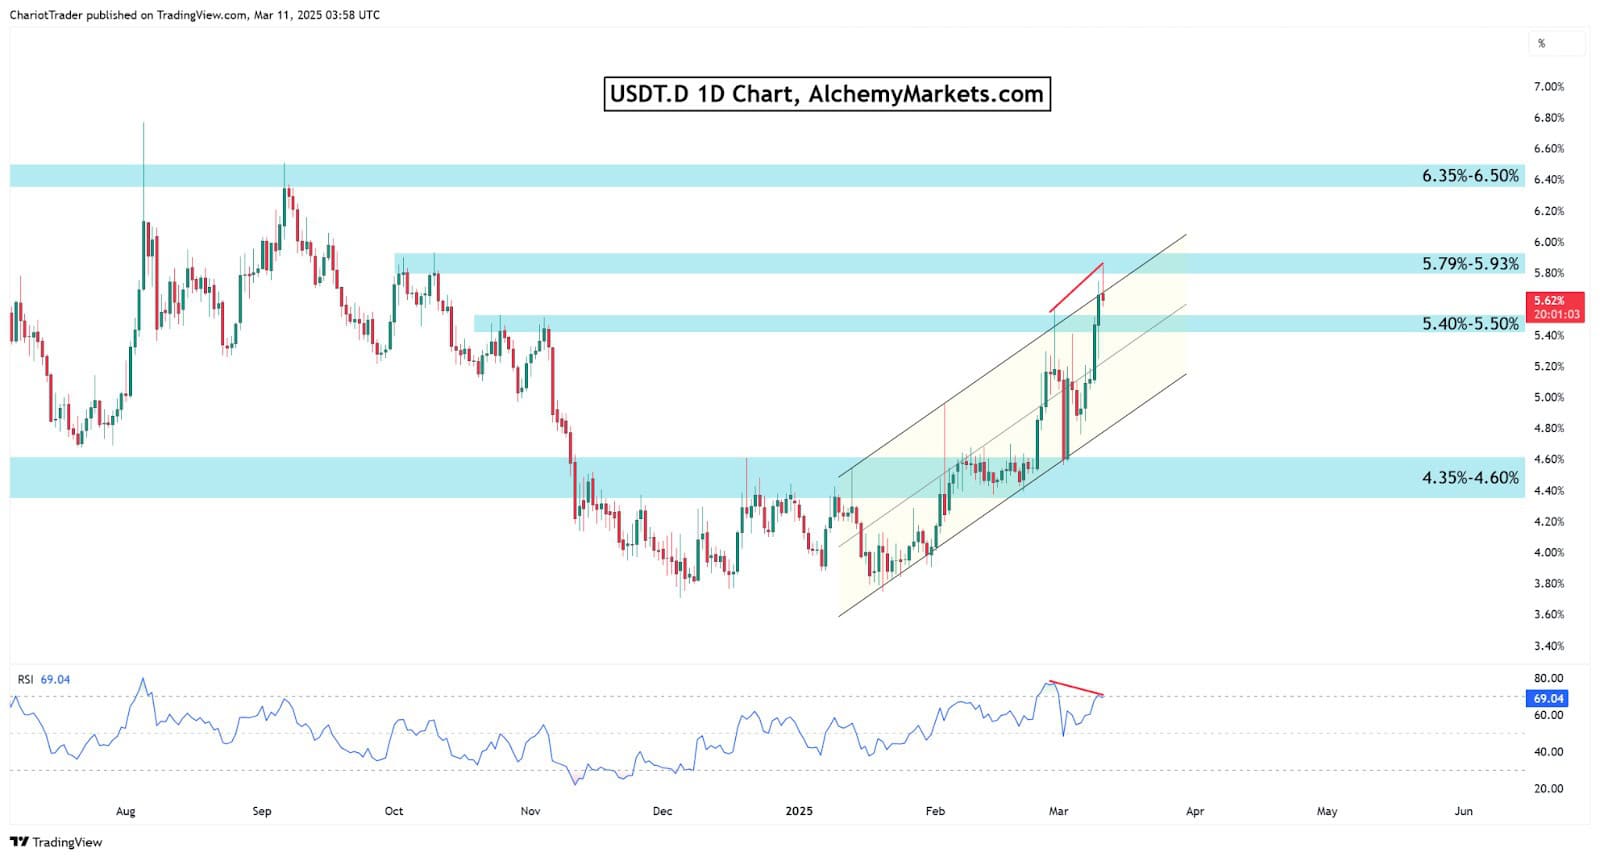
USDT.D has currently tapped into a major resistance at 5.79%-5.93%.
This zone has previously served as a resistance, and with a bearish divergence in play, we could expect the USDT dominance to pull back, either after consolidating at the resistance, or from here.
A rising parallel channel formation also supports the idea for a drop, at least towards the Channel’s midpoint, or 5.40%-5.50%. A further pullback would land us at the channel’s lower trendline, which, if broken, could take USDT.D to 4.60%.
That being said, a breakout from this rising channel would be bearish for the crypto market. The next major high would then be around 6.35%-6.50%, putting more pressure on the crypto market.
Bitcoin Approaches Fibonacci Support Levels
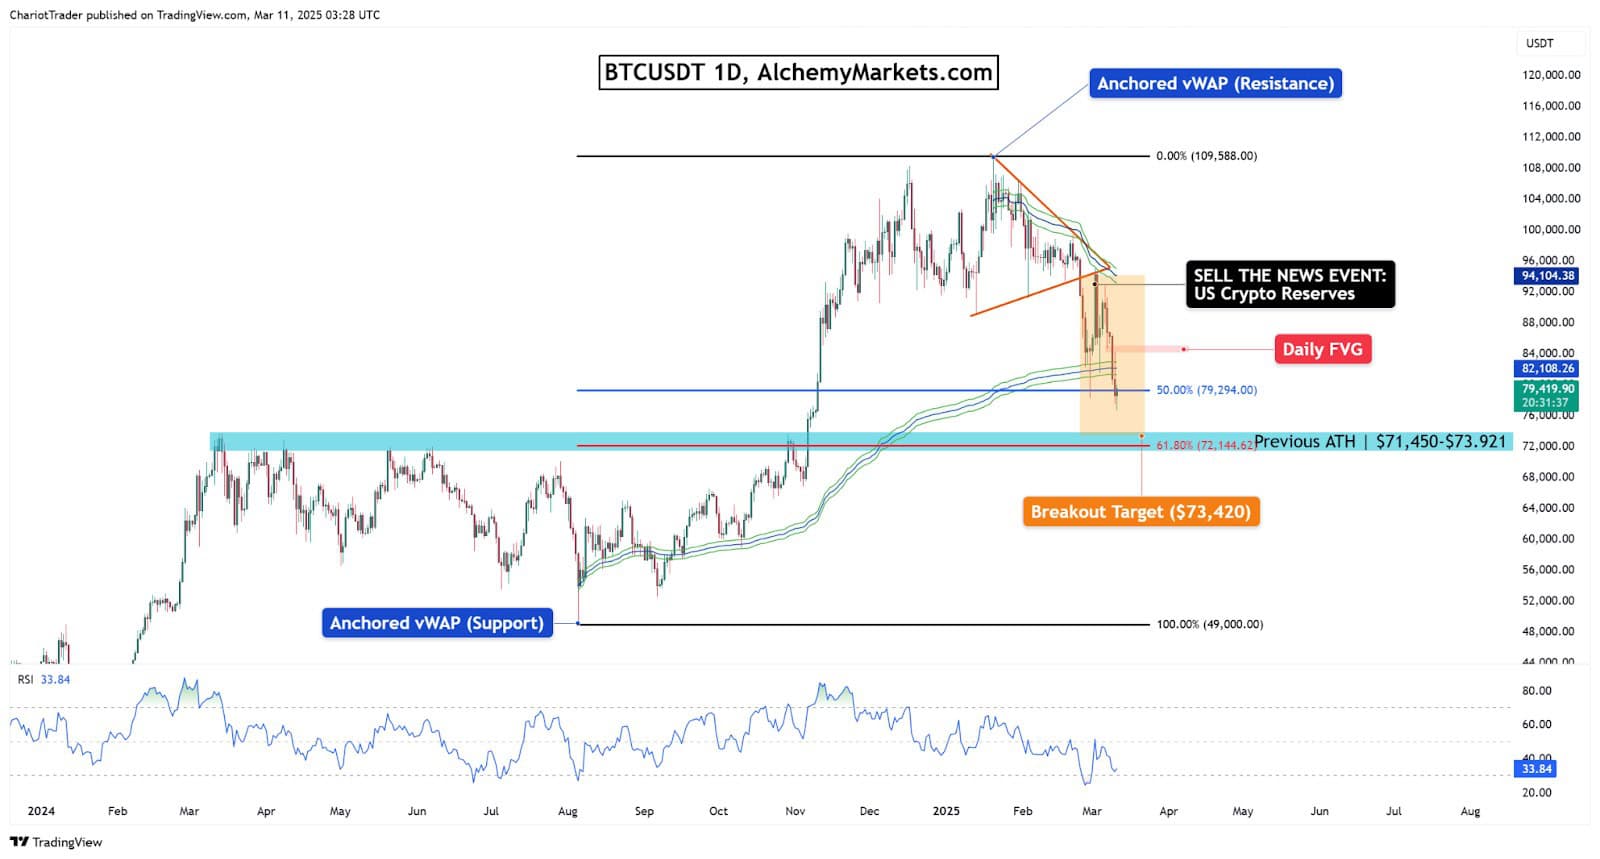
Bitcoin is currently at a Fibonacci retracement support at $79,294, which is currently supporting the price. If a pivot bounce occurs, a daily Fair Value Gap at $84,131–$85,151 could provide some resistance.
There’s also the anchored vWAP to consider—drawn from the major lows in August, the anchored vWAP provided a strong bounce in February when it was reached. However, we are now below the anchored vWAP, flipping it into resistance at $82,108.
Should the Bitcoin descend further, the most critical level to watch would be the 61.80% Fib level at $72,144.62. This aligns perfectly with the previous All-Time-High (ATH) zone of $71,450–$73,921. There is also a bullish divergence to be found on the daily RSI, supporting the idea of a potential bullish reversal.
You may also be interested in: