


Written by:

- Chart of the Day
- March 6, 2025
- 1 min read
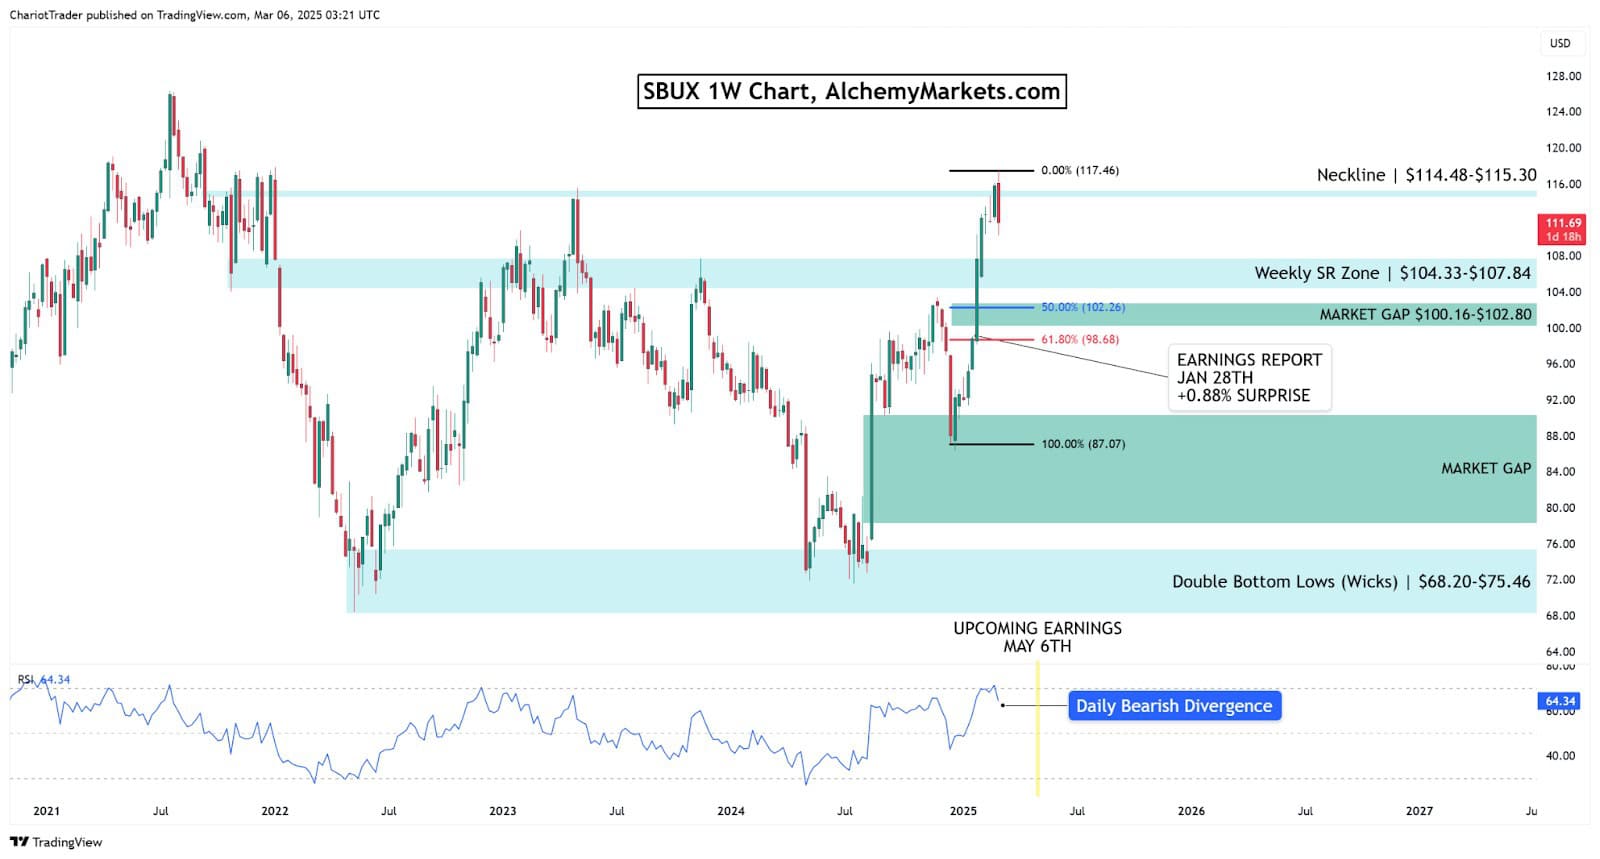
Starbucks (SBUX) At Double Bottom Neckline Resistance
Fuelled by a surprisingly positive earnings report in January, the SBUX has rallied into a double bottom neckline at approximately $114.48 to $115.30. This rejection comes with no weekly bearish divergence, but there is a daily bearish divergence.
Fading the neckline here to trade towards the lows at approximately $68.20-$75.46 is a possible play here, but would be a risky one. Multiple key supports below have formed since 2024, offering several bounce points for the asset.
The closest support lies between $104.33-$107.84, a prior resistance that has now been overcome. A long position could be considered in this area if the price holds, and SBUX consolidates.
The most critical zone to watch would be between $100.16-$102.80, where a bullish market gap lies, and aligns with the 50% Fibonacci level at $102.26. If the price dips slightly below, the 61.80% Fib support would come in at $98.68.
All in all, SBUX is forming a bullish reversal pattern, but keep an eye on support levels within the range for now. A rejection assisted by a daily bearish divergence could mean SBUX needs to consolidate further before a true breakout.
You may also be interested in:


