What is the On Balance Volume Indicator?
The On Balance Volume (OBV) tool is a technical indicator used to gauge momentum by tracking the flow of volume in relation to price changes. Created by analyst Joseph Granville in the 1960s, the OBV indicator helps traders assess the strength of price moves and anticipate potential reversals. It can also be used to identify periods of accumulation and distribution, helping traders identify breakout opportunities.
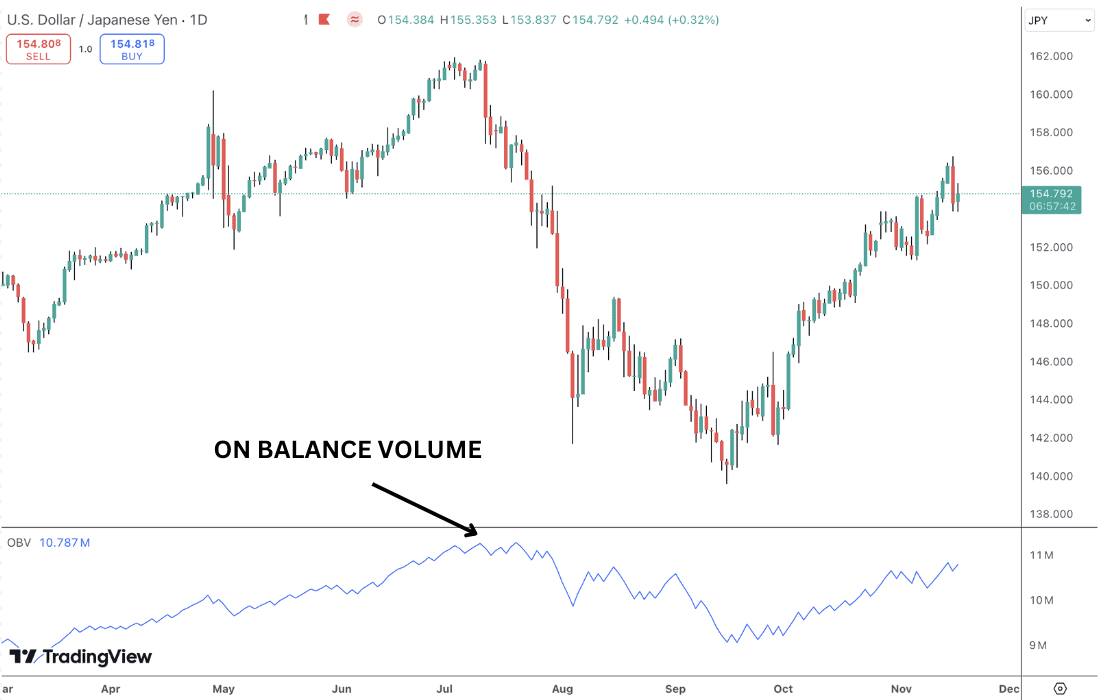
The indicator works by adding volume to a cumulative total on days when price closes higher and subtracting it when price closes lower. The resulting OBV indicator line reflects the net buying and selling pressure in the underlying asset and there the price change. A rising line means increasing buying volume and a falling line means increasing selling volume.
How Does the On Balance Volume Indicator Work?
The OBV indicator works by calculating a cumulative running total of trading volume based on price movements, which reflects the momentum behind price trends. The calculation follows these basic rules:
- Up Day (Price Increase): If today’s closing price is higher than the previous day’s closing price, the day’s volume is added to the previous OBV indicator total, pushing the indicator’s line higher.
- Down Day (Price Decrease): If today’s closing price is lower than the previous day’s closing price, the day’s volume is subtracted from the previous OBV indicator total, dropping the OBV line lower.
- No Change: If today’s closing price is the same the previous day’s closing price, the OBV remains unchanged

Please note, the OBV indicator readings will be related to the timeframe you are trading. In the example above, we are referencing the daily timeframe. If you were on the 1hr chart, for example, the OBV indicator would update at the close of each hourly session.
What Does OBV Tell You?
The OBV indicator is an effective market analysis tool, providing insights into the strength or weakness of the underlying security’s price by analyzing volume and price movements.
Here’s what the OBV indicator can reveal:
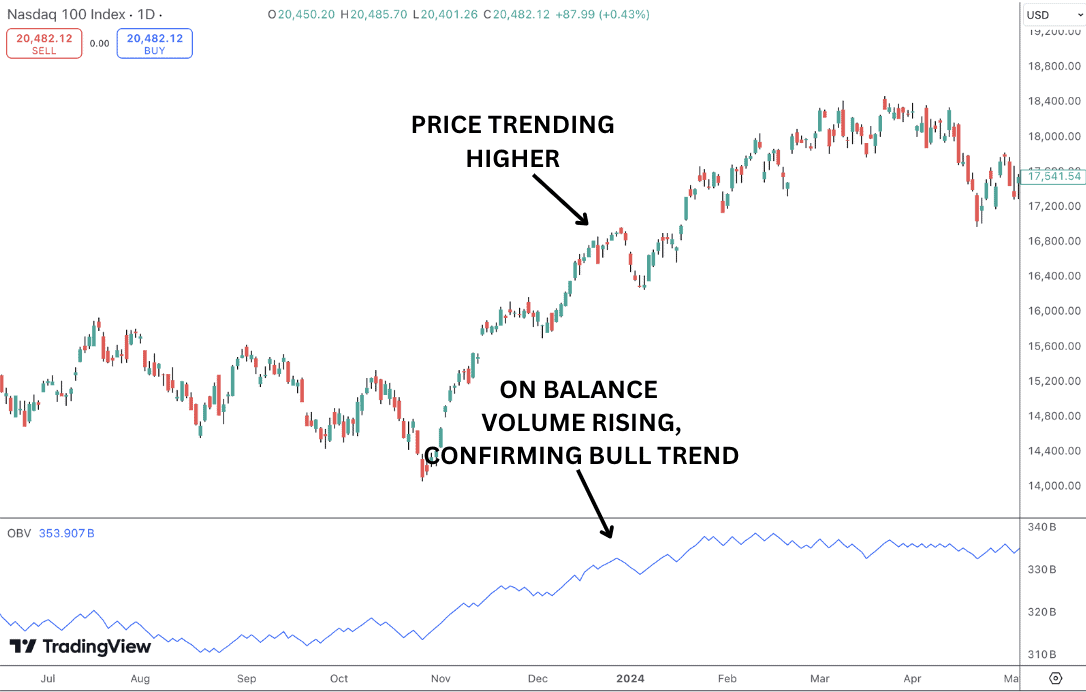
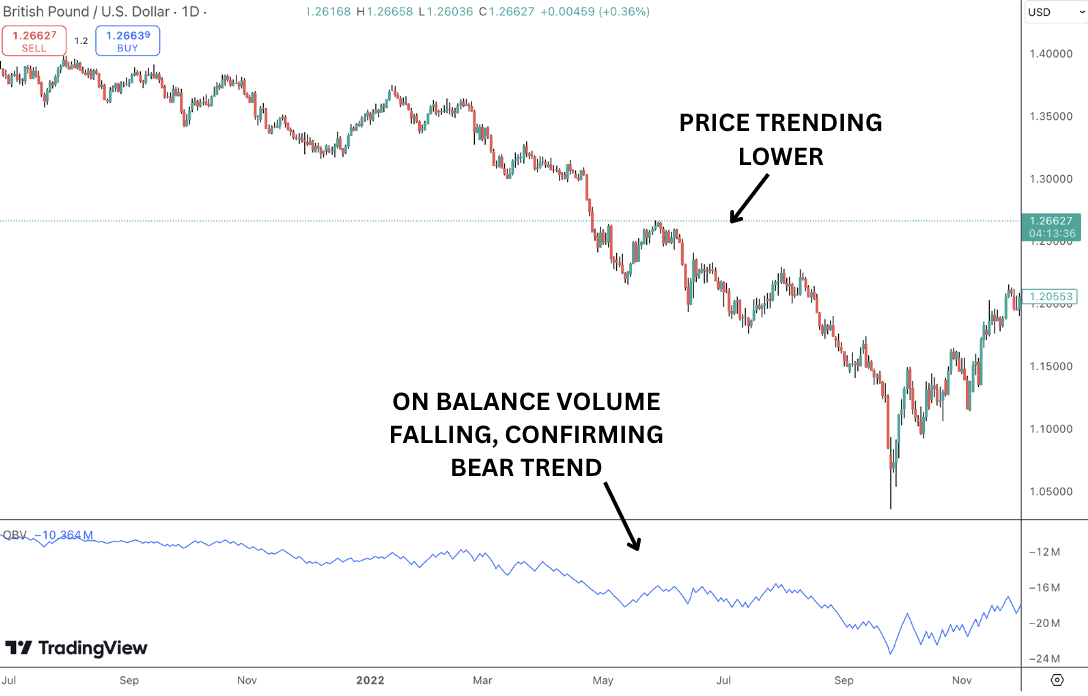
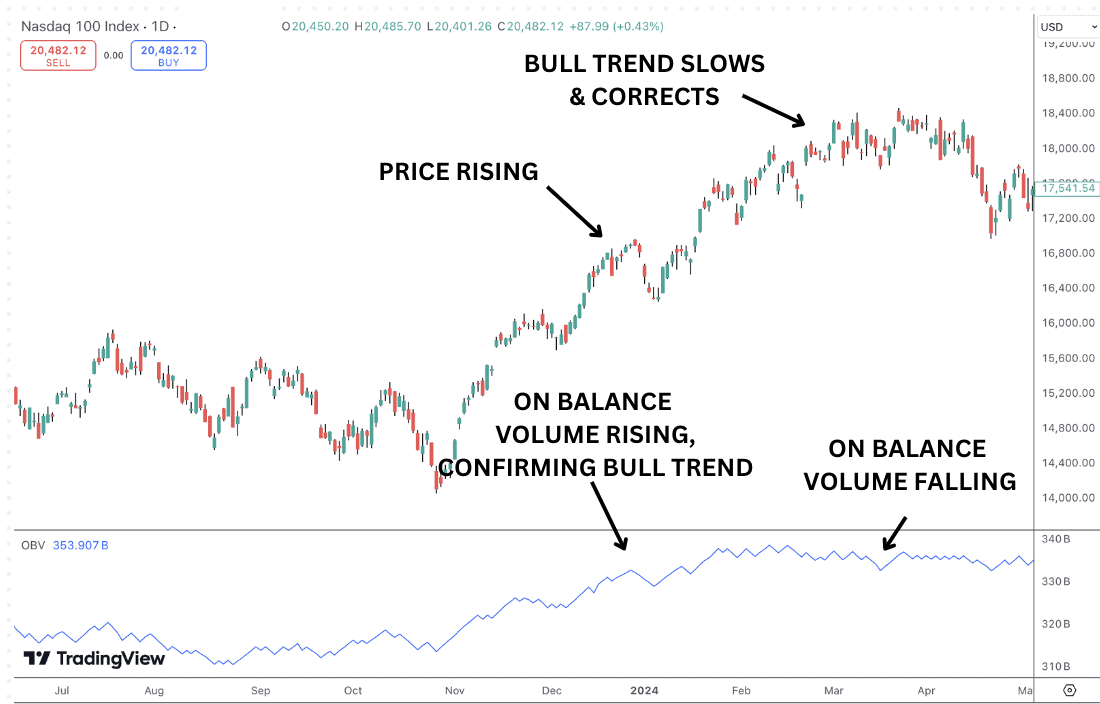
- Trend Confirmation: When On Balance Volume moves in the same direction as the price trend (both rising or both falling), it suggests the trend is strong and likely to continue. Rising on balance volume in an uptrend indicates robust buying interest, while falling on balance volume in a downtrend suggests solid selling pressure.
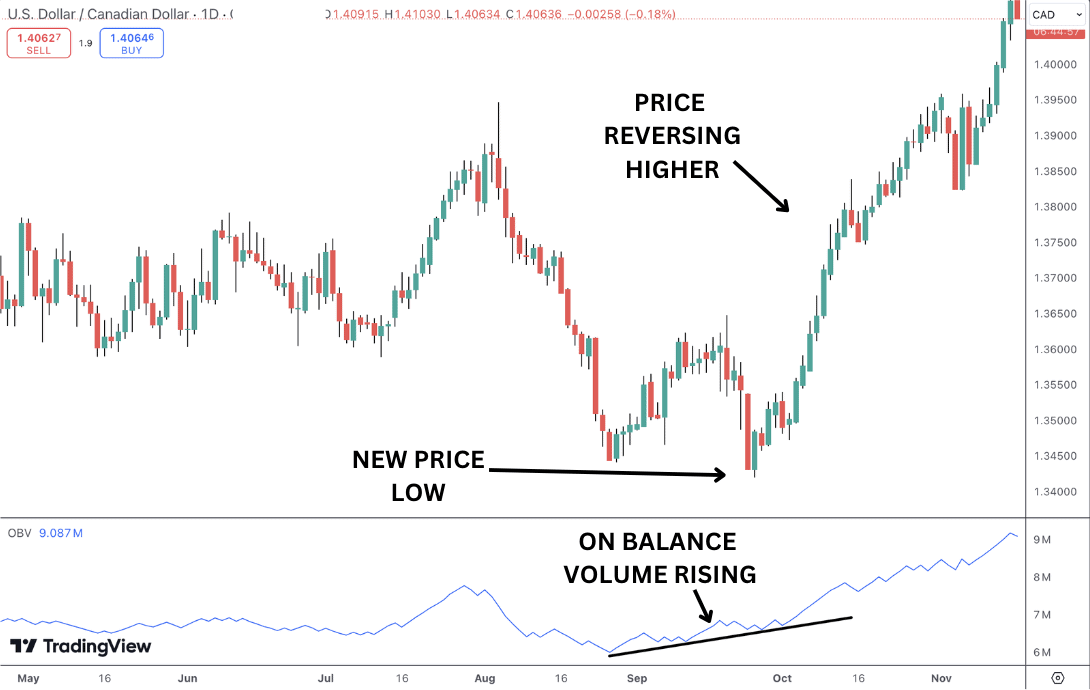
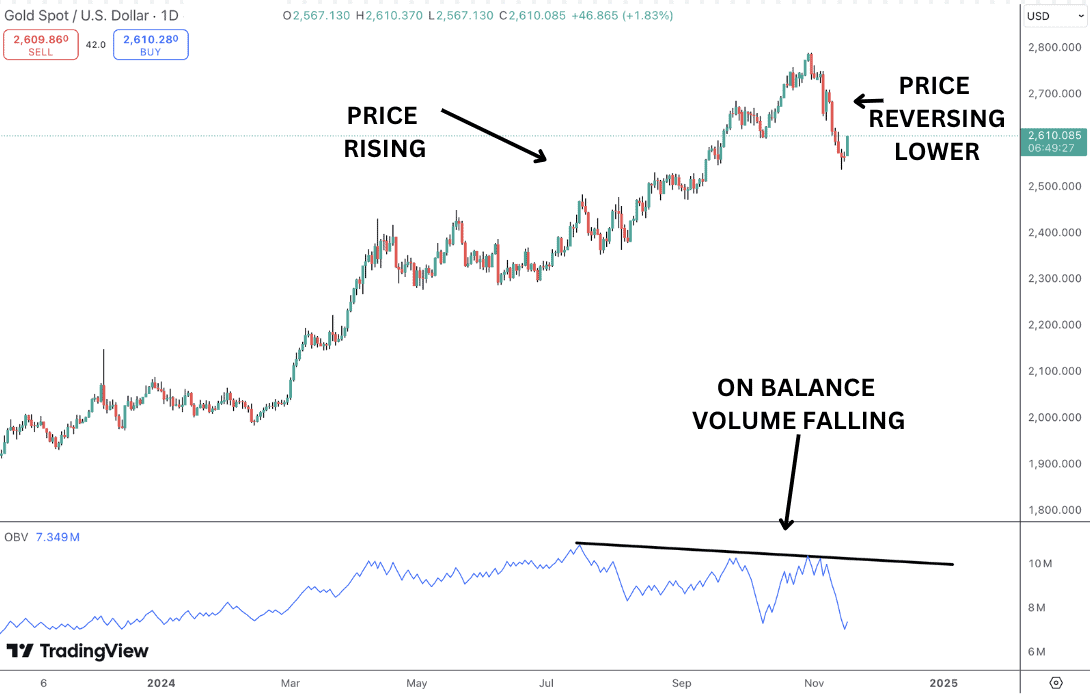
- Potential Reversals (Divergence): When on balance volume and price diverge, it may signal a potential trend reversal is forthcoming. For example, if price is rising but on balance volume is falling, it can indicate weakening buying pressure and the possibility of a price decline. Similarly, if on balance volume rises while price falls, it may suggest that sellers are losing momentum and a bullish reversal could be near.
- Breakout Signals: Sharp changes in on balance volume, especially during consolidation, can hint at an upcoming breakout. A spike in On Balance Volume during a price range might signal that buyers or sellers are preparing to drive price significantly higher or lower.
How Do You Read OBV Divergences?
- Bullish Divergence: Bullish divergence occurs when price is making lower lows, but OBV is making higher lows. This indicates that, although price is declining, buying volume is increasing, suggesting that buyers are beginning to gain control. This divergence can signal a potential reversal to the upside, meaning price might soon rally, offering potential buying opportunities.
- Bearish Divergence: Bearish divergence occurs when price is making higher highs, but OBV is making lower highs. This suggests that, although price is rising, selling volume is increasing, indicating that the buying pressure behind the uptrend is weakening. This divergence can signal a potential downward reversal, meaning the price might soon decline, offering potential selling opportunities.
How Do You Use OBV for Trend Confirmation?
Here’s how to use the OBV indicator to confirm trends:
- Uptrend Confirmation: In an uptrend, the OBV should generally rise along with price. This suggests that positive volume (buy volume) is supporting the upward price movement, meaning the trend is more likely to continue. If both price and OBV are making higher highs and higher lows, the uptrend is considered strong and confirmed. Once OBV starts to move lower, this is a good signal that the uptrend is running out of steam.
- Downtrend Confirmation: In a downtrend, OBV should decline along with price. This indicates that negative volume (selling volume) is strong and supports the downward movement, suggesting that the trend is likely to persist. If both price and OBV are making lower lows and lower highs, the downtrend is considered validated. Once OBV starts to move higher this is a good signal that the uptrend is running out of steam.
Importance of On Balance Volume Indicator
The On Balance Volume indicator is highly useful for traders as it provides a better understanding of what’s driving a stock’s price trends by analyzing volume. Since volume often reveals the “real story” behind price movements, OBV helps identify whether buyers or sellers are in control. This makes it particularly effective for evaluating the strength of a trend; for example, if prices are rising but OBV isn’t increasing, it may suggest the trend isn’t likely to last.
The key thing to remember with OBV is that the direction of the line is more important than the value itself and changes in direction are particularly important. If OBV starts to drop while prices are still climbing, it can warn of an upcoming decline.
Simple to use and apply, OBV works well across different markets and timeframes. It’s also helpful for identifying potential breakouts, especially when volume spikes during a period of price consolidation. Overall, OBV helps traders anticipate price changes and make more informed decisions.
Alongside its use in confirming trends and spotting potential reversals, On Balance Volume is also important because it helps traders identify periods of accumulation or distribution in range-bound markets, offering traders the chance to capitalize on ensuing breakouts.
How to Calculate On Balance Volume
Calculating on balance volume is a very easy process and can be thought of as a simple running total. Each session, if that candle closes higher than the previous close, the gain is added to the cumulative total, meaning the On Balance Volume value will rise. If price closes lower on that session, however, the sessions volume is subtracted from the cumulative total, meaning the OBV value will fall.
On Balance Volume Formula
The formula for OBV is:
OBV = OBVPrev + Latest Volume*
*Latest volume is dependent on the closing price.
If today’s close > previous close (ie – a green day), then add today’s volume as Latest Volume.
If today’s close < previous close (ie- a red day), then subtract today’s volume as Latest Volume.
If today’s close = previous close, then add 0 for today’s volume.
Where:
OBV = Current on-balance volume level
OBVPrev = Previous on-balance volume level
Volume = Latest trading volume amount
On Balance Volume Example
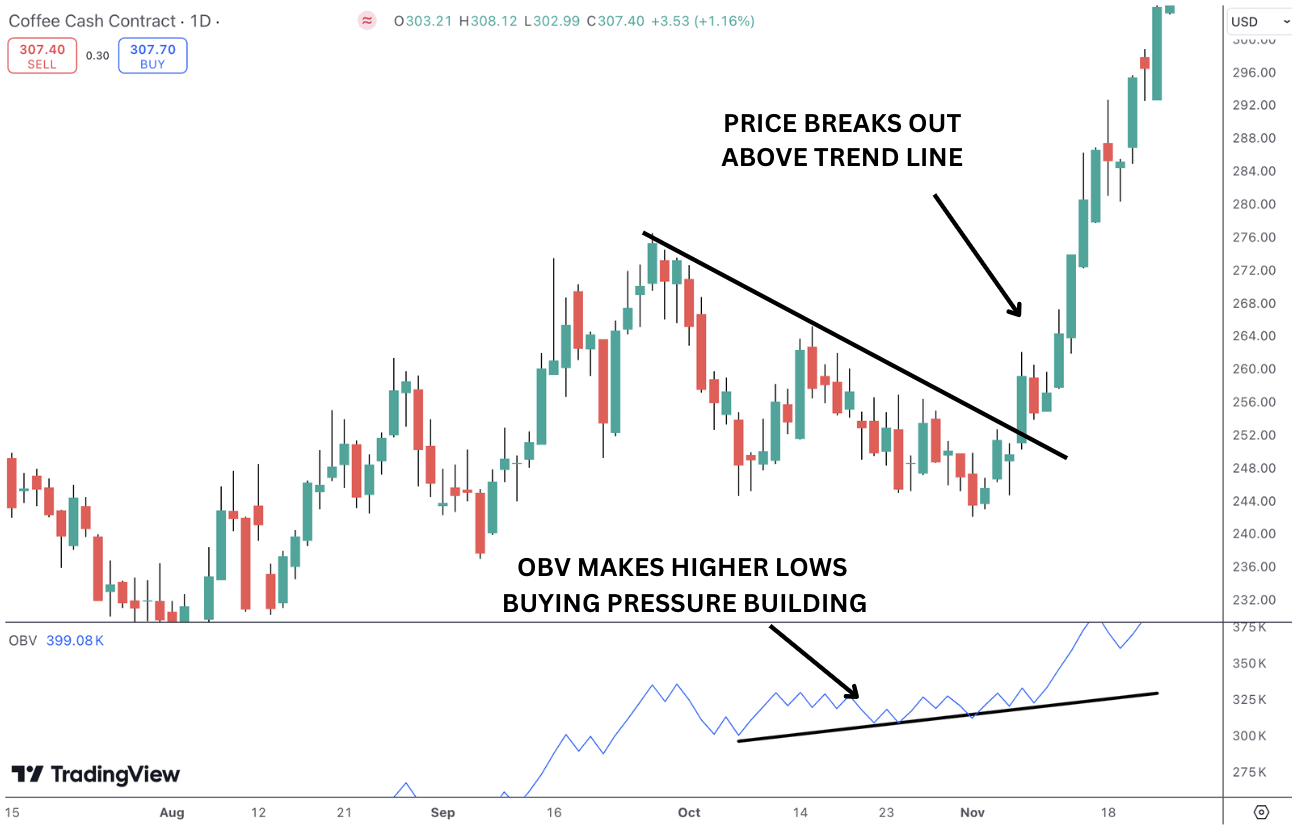
In the chart below, we can see an example of volume accumulation in Coffee. Price is correcting lower, framed by a bearish trend line, but we can see OBV is rising, suggesting buying pressure is building, leading to a breakout higher. Later on, we will look at how to trade these situations.
On Balance Volume Trading Strategies
The On Balance Volume indicator is an incredibly versatile tool that can help traders gain an edge with their analysis and execution. Through analysing volume in relation to price trends, the indicator is equally adept at spotting reversals as it is in highlighting breakouts. Below we will explore some detailed strategies looking at how you can use the indicator by itself or alongside other indicators.
OBV Trendline Strategy
The OBV trendline strategy is a technique used to identify potential breakout and reversal points by drawing trendlines directly on the On Balance Volume indicator rather than the price chart.
Here’s how it works:
- Draw Trendlines on OBV: Just like on a price chart, draw trendlines connecting OBV highs in a downtrend or On Balance Volume lows in an uptrend. These lines act as support and resistance levels for the OBV indicator itself.
- Watch for Breakouts: When OBV breaks above a downward trendline, it can signal that buying volume is picking up, potentially leading to a bullish breakout in price. Conversely, if OBV breaks below an upward trendline, it can indicate that selling volume is increasing, suggesting a bearish price breakdown.
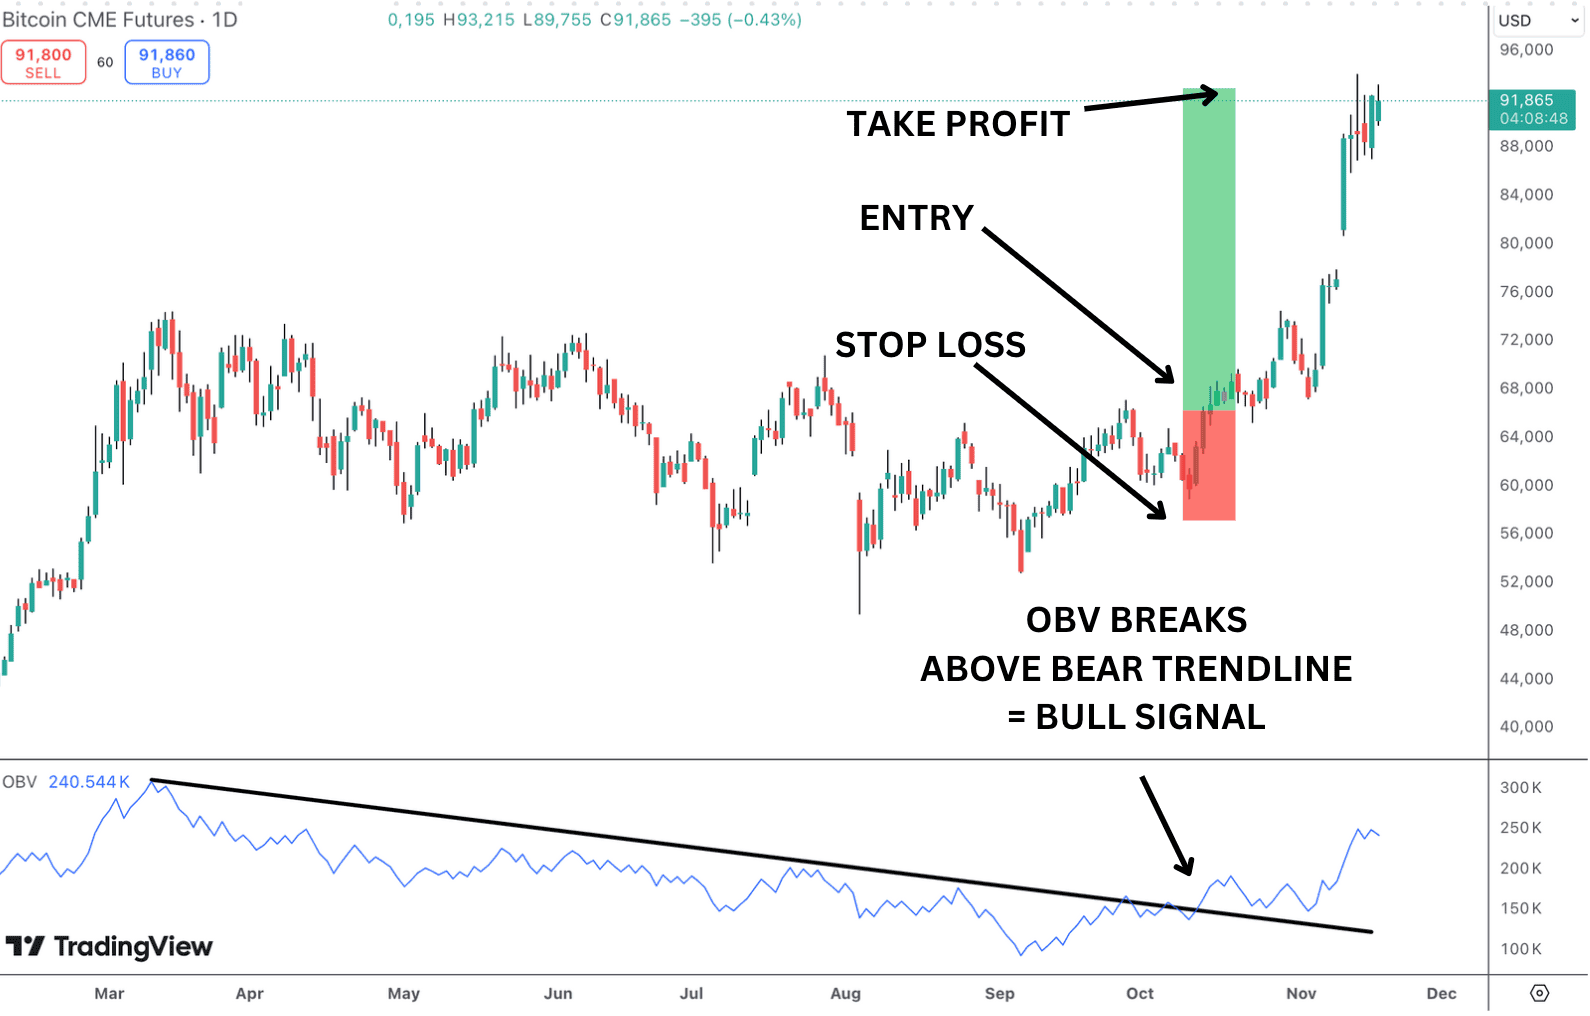
In the chart below, we can see an example of a bullish On Balance Volume trendline break in Bitcoin. We can enter on the break of the candle high that forms as On Balance Volume breaks above the trend line, with a stop below the last swing low. We then target a minimum of 3x our stop loss to ensure good risk:reward on the trade.
OBV Divergence Strategy
This strategy involves identifying divergence between the On Balance Volume indicator and price movements to anticipate potential trend reversals.
Here’s how to apply an OBV divergence strategy:
- Identify Divergences: Look for points where price and OBV move in opposite directions:
- Bullish Divergence: Price makes lower lows, but OBV makes higher lows. This suggests that, despite the price decline, buying volume is increasing, indicating that buyers may be quietly gaining control. This could signal an upcoming price reversal to the upside, offering a buying opportunity.
In the chart below, we can see an example of bullish divergence and a resulting long trade in AUDUSD.
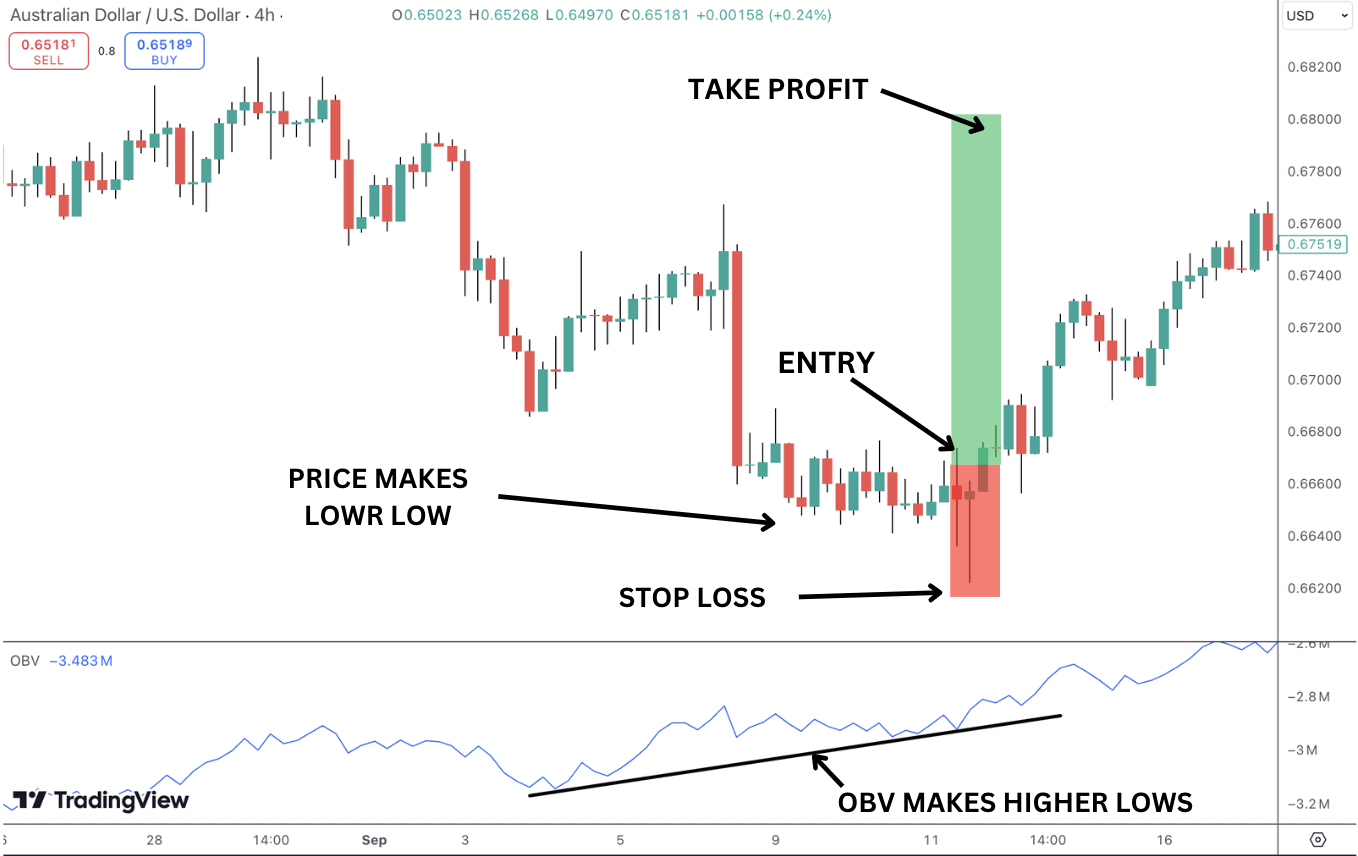
Price is making lower lows, but On Balance Volume is moving higher, suggesting the bear trend is losing steam and price is vulnerable to a reversal higher. We then get a large bullish pin bar, giving us an entry signal to trade the following move higher.
- Bearish Divergence: Price makes higher highs, but OBV makes lower highs. This shows that although the price is rising, selling volume is growing, which may indicate that sellers are preparing for a reversal, possibly leading to a price drop, offering a selling opportunity.
In the chart below, we have an example of a sell trade using bearish On Balance Volume divergence in EURJPY.
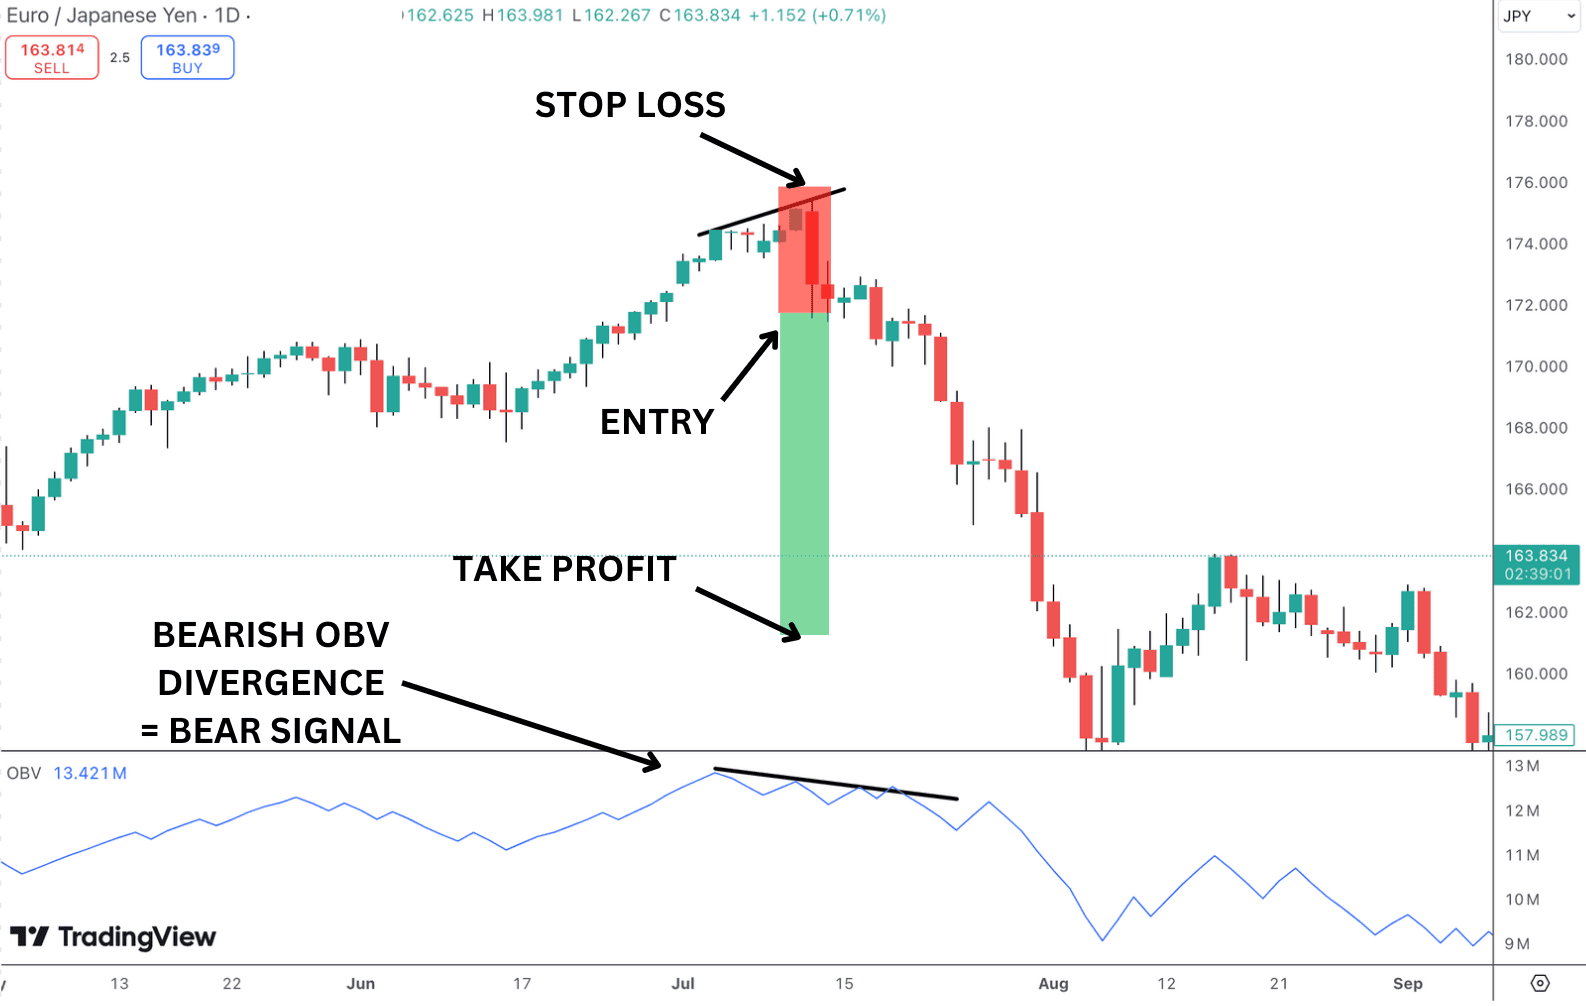
As price pushes into highs, the OBV indicator is moving lower. We then get a large bearish reversal candle which gives us our entry point for the trade.
OBV Breakout Strategy
The On Balance Volume breakout strategy focuses on identifying significant breakouts in volume that precede major price moves, using OBV as a leading indicator.
Here’s how to implement this strategy:
- Identify Consolidation in OBV: Look for a period where OBV is moving sideways or within a defined range. This usually suggests that there is no clear trend in buying or selling pressure, even if the price itself may be moving up and down within a range.
- Draw OBV Trendlines: Draw horizontal lines on the OBV chart to mark key resistance and support levels. These levels represent where OBV has previously struggled to break through or below, signaling a potential breakout level if crossed.
- Bullish Breakout: If OBV breaks above resistance and price follows with an upward breakout, it can be a signal to enter a long position.
- Bearish Breakdown: If OBV breaks below support and price confirms the move with a breakdown, it could be a signal to enter a short position.
In the chart below, we can see a bearish example in EURUSD.
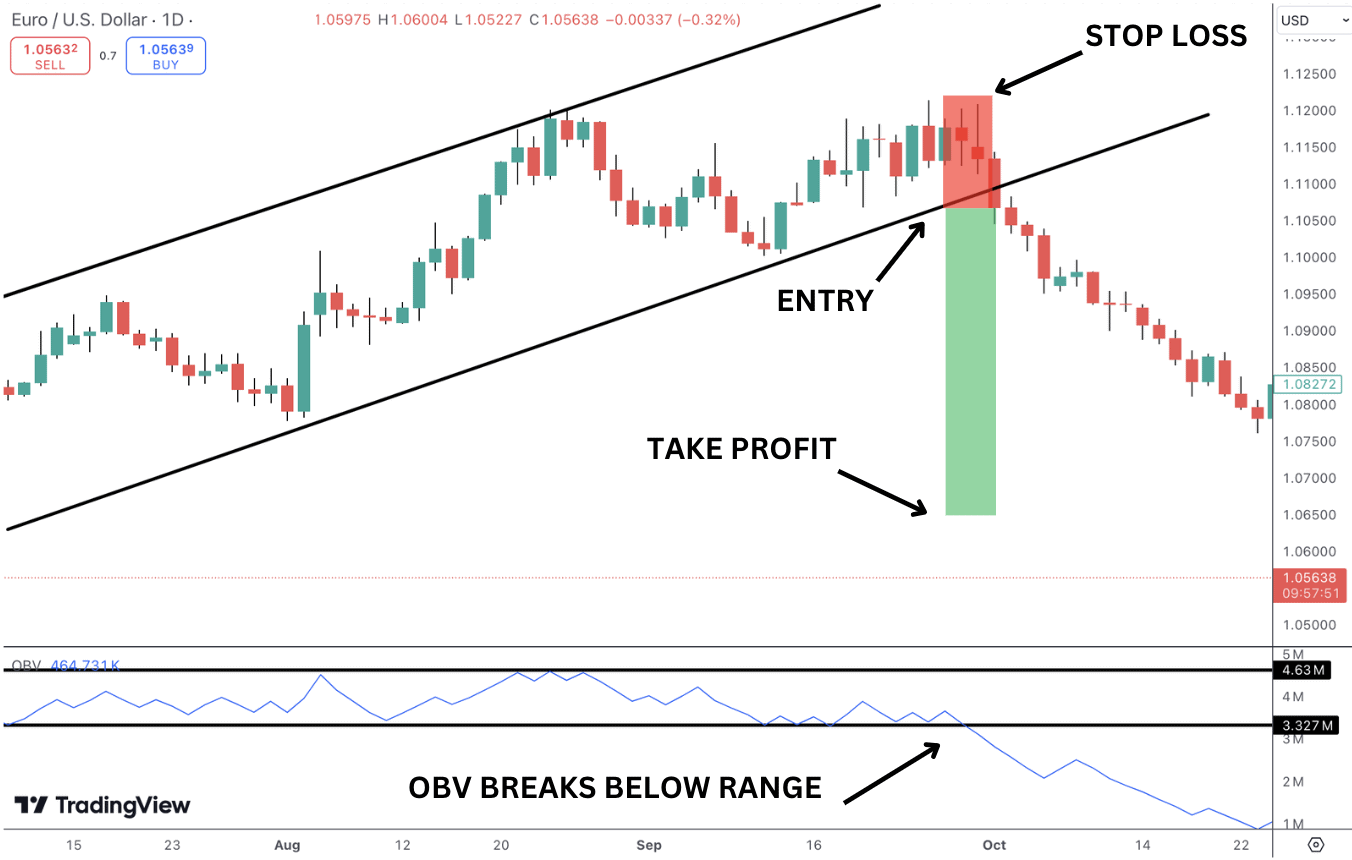
Price is trading higher within a channel, but notice that OBV is moving in a clear sideways range. As OBV breaks below the range lows, we can sell the pair, positioning for a channel break and reversal lower.
OBV with Moving Averages
In the same way that we can apply moving averages to price, we can also apply them to the OBV indicator. This can be a powerful way to identify trading signals based on the typical moving average premise that if OBV crosses above its moving average, it is a bull signal. Conversely, if it crosses below the moving average, it is a bearish signal. Combining this with some basic chart structure reading can be a really easy way to find great trading opportunities.
In the chart below we have applied the simple moving average to the OBV indicator.
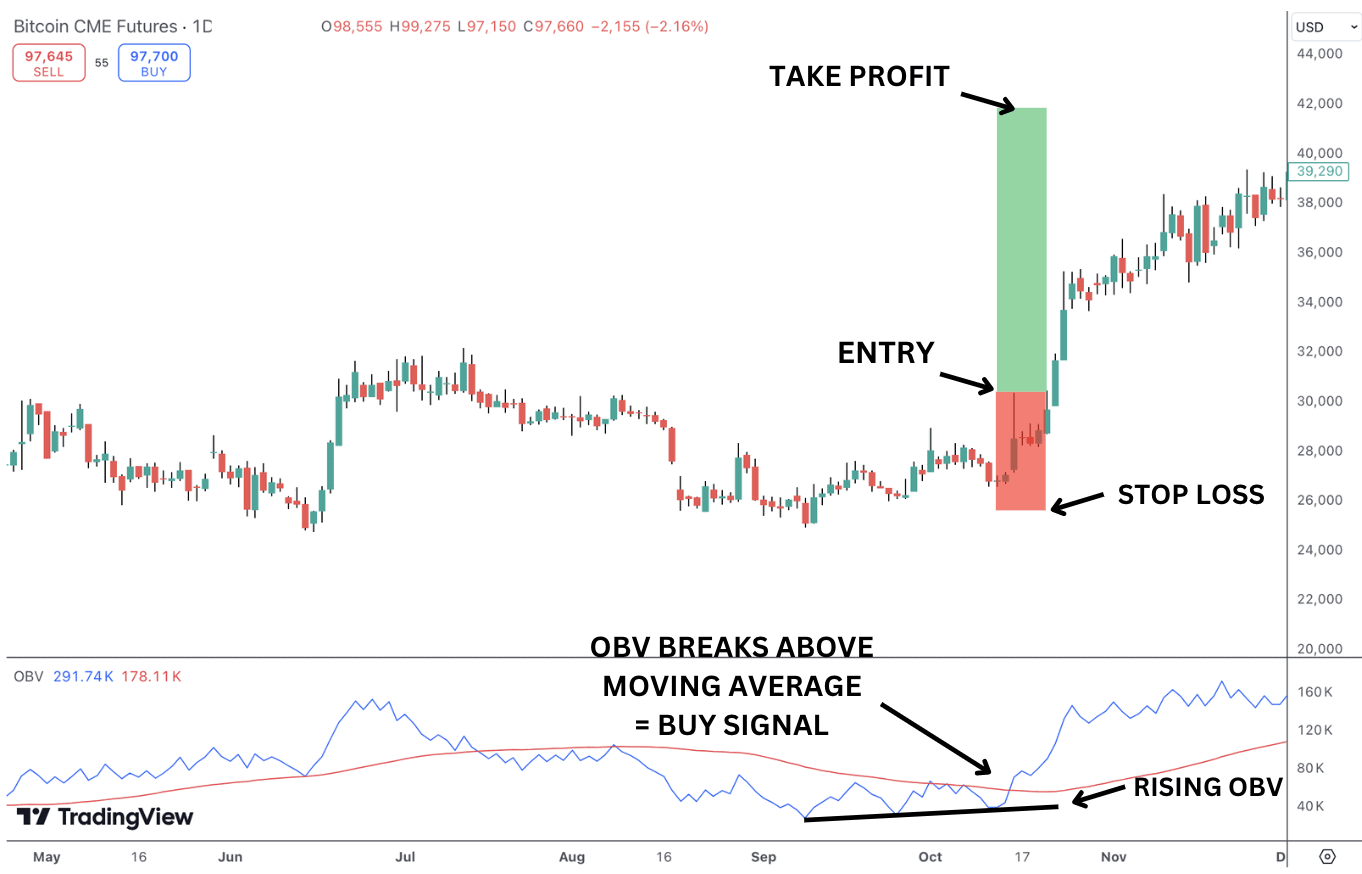
In this example, we have bitcoin trading in a sideways range. OBV begins rising, telling us that bullish pressure is building and shortly after we see OBV break above its moving average. This gives us a buy signal to capitalize on the breakout higher that follows.
In the chart below, we have an example of a bearish setup.
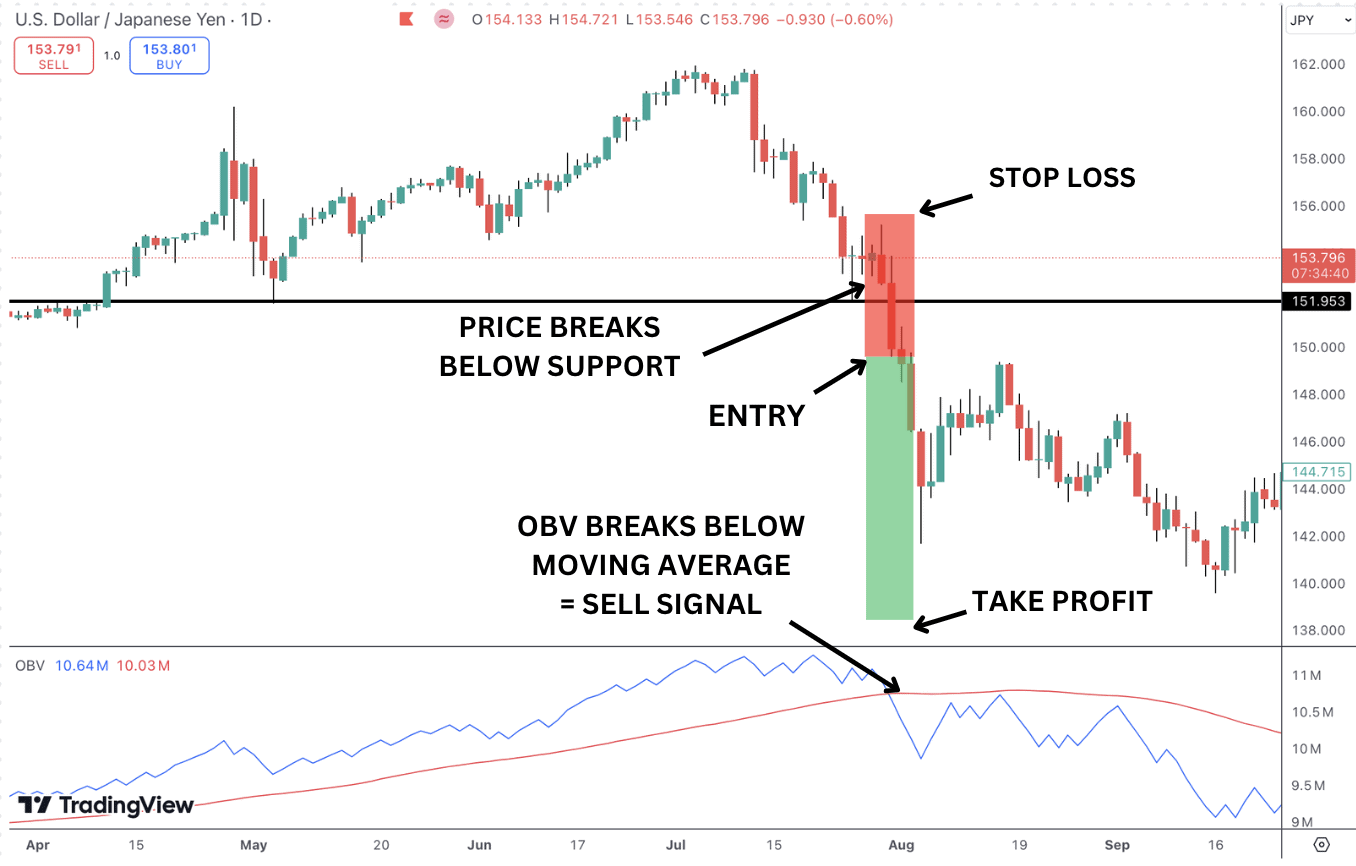
Price trending higher but then reverses and turns sharply lower. As price breaks below support we see that OBV breaks below its moving average, giving us a bearish signal to place a sell trade.
OBV with RSI
Given that both OBV and RSI (Relative Strength Index) measure momentum in the market, the two indicators match up very well and can be used for simple yet powerful trade entries.
Let’s explore how to use the two indicators:
Bullish Setup: Look for the RSI indicator to move below the oversold threshold then cross back above 30. This suggests that momentum is overstretched to the downside and is now normalising, potentially signalling a bullish price reversal. To execute a long trade, we want to see OBV break above the last indicator peak, this confirms the bullish reversal signal giving us an entry point for a long trade.
In the chart below, we can see an example of a bullish setup using this method in USDCAD.
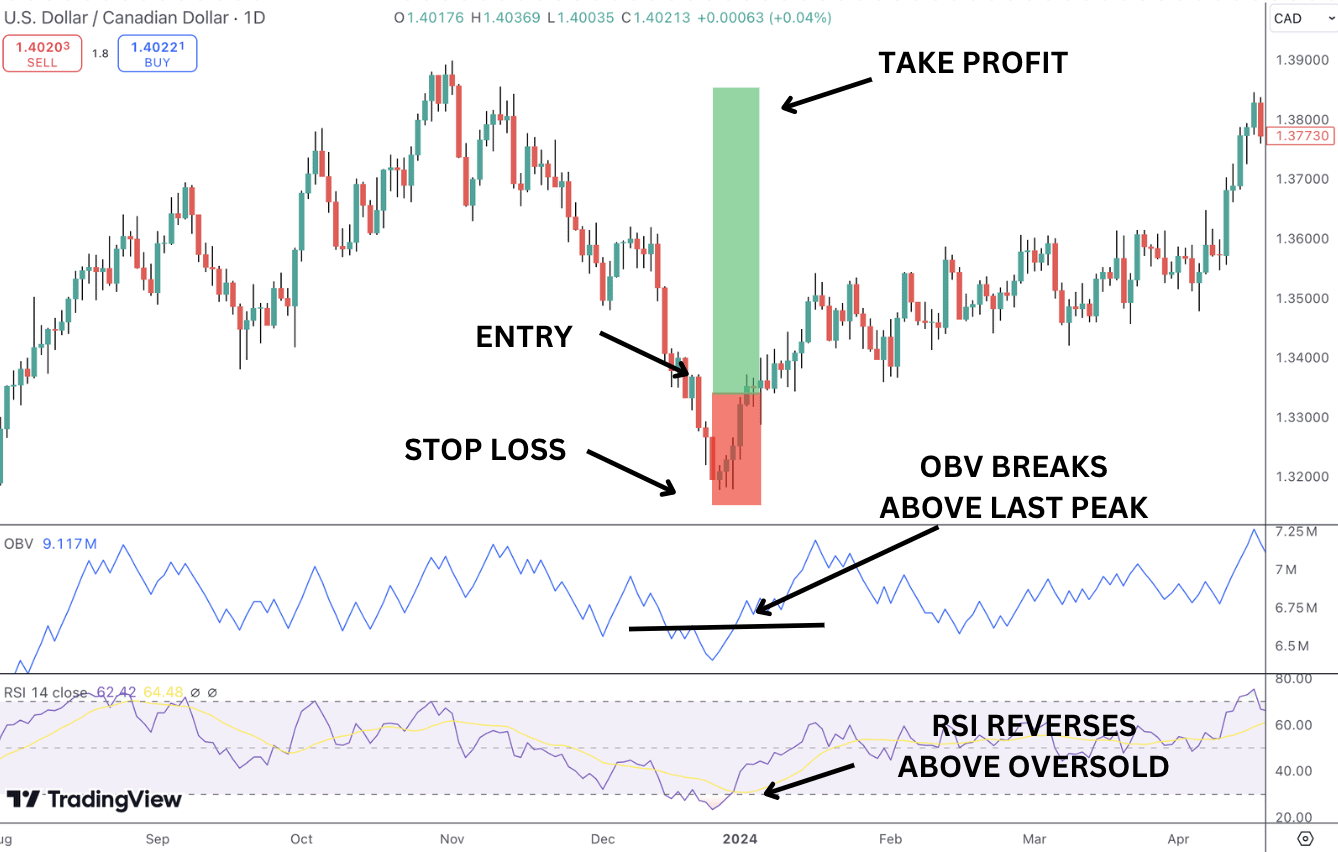
We enter long on the break of the high of the candle that forms as OBV breaks above its last peak following RSI reversing off the oversold level. Our stop is then placed below the recent swing low.
Bearish Setup: Look for the RSI indicator to move above the overbought threshold then cross back below 70. This suggests that momentum is overstretched to the upside and is now normalising, potentially signalling a bearish price reversal. To execute a short trade, we want to see OBV break below the last indicator lows, this confirms the bearish reversal signal giving us an entry point for a short trade.
In the chart below, we can see an example of a bearish set up.
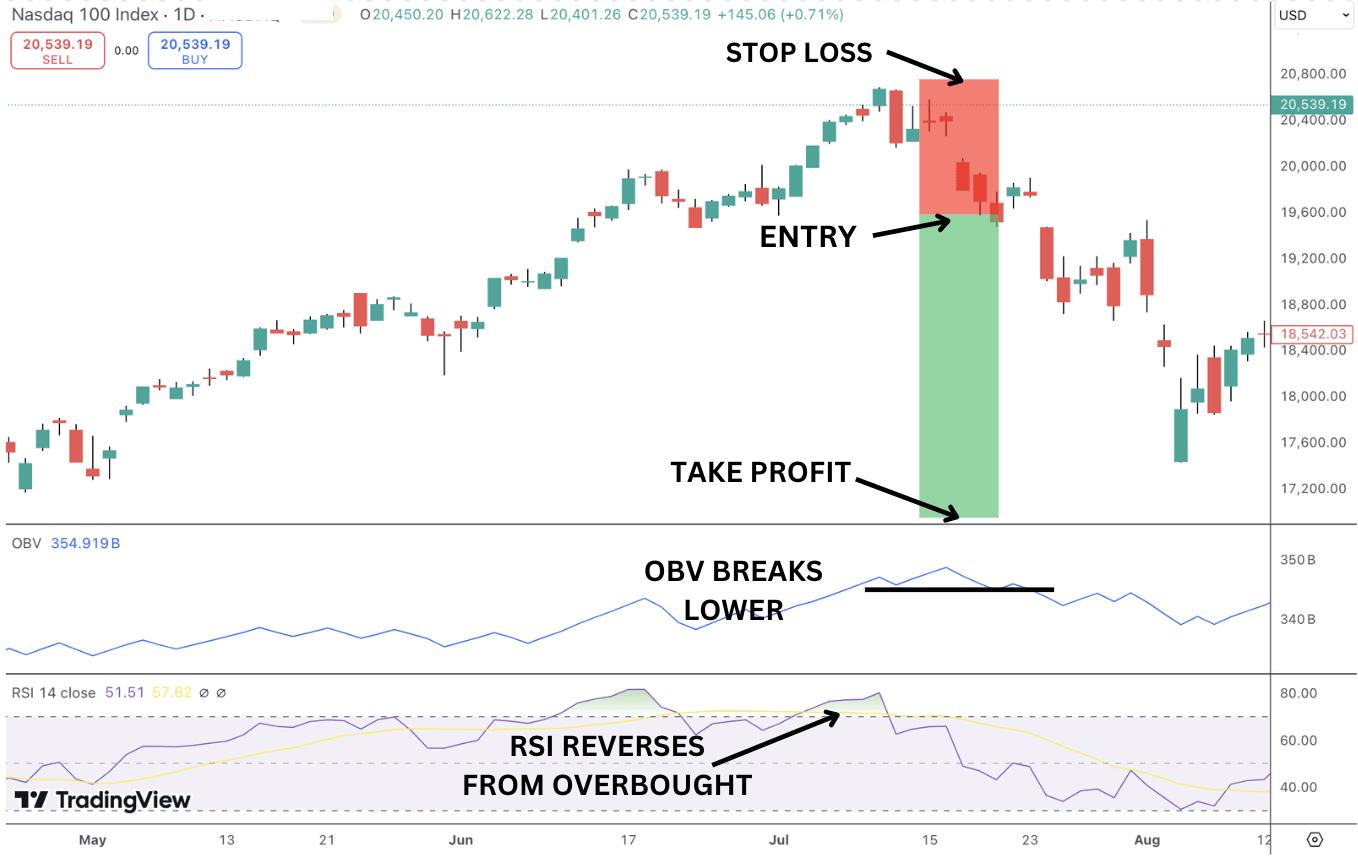
In the chart, the RSI is reversing from overbought territory as price breaks lows. This move is confirmed by the OBV which also breaks lower, giving us a signal to enter short.
Interestingly, notice how before this reversal occurs, we see RSI reversing lower from overbought. However, the move fails and the price pushes higher again. Using OBV for confirmation means we would have avoided a losing trade there because OBV didn’t break below the last indicator low, meaning no sell entry.
This is a great example of how combining indicators can help improve your trading.
OBV with Support and Resistance Levels
Another fantastic way to trade using the on balance volume indicator is to combine it with support and resistance levels. When looking to find reversal trades, we can identify support or resistance levels in the market then watch the OBV indicator for above volume changes as price tests the level. OBV divergences can be particularly useful in this strategy.
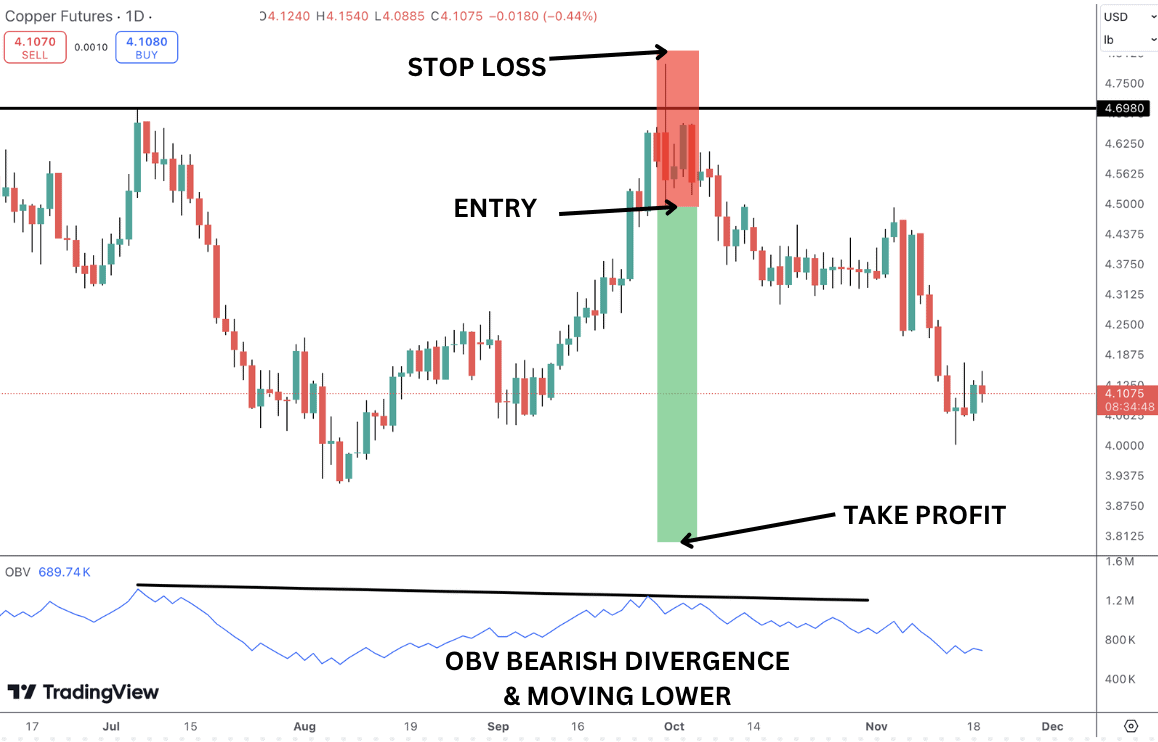
For example, we can establish a resistance level in the market then wait for price to test it. If we see bearish OBV divergence, this is a good sign that price is going to fail and reverse from the level. We can then enter a short trade if the price moves lower and the on balance volume line confirms. We can see an example of this method in the Copper chart below .
How OBV Can Reveal Market Player Strategy
On Balance Volume can provide insights into the strategies of market players by analyzing how volume behaves relative to price movement.
Here’s how OBV can reveal market player strategies:
- Accumulation: When On Balance Volume rises steadily as price is moving sideways or slightly down, it indicates that larger players are quietly buying (accumulating) while smaller players continue to sell, preventing a significant price rise. This often precedes a price breakout.
In the chart below, we have an example of accumulation in practice.
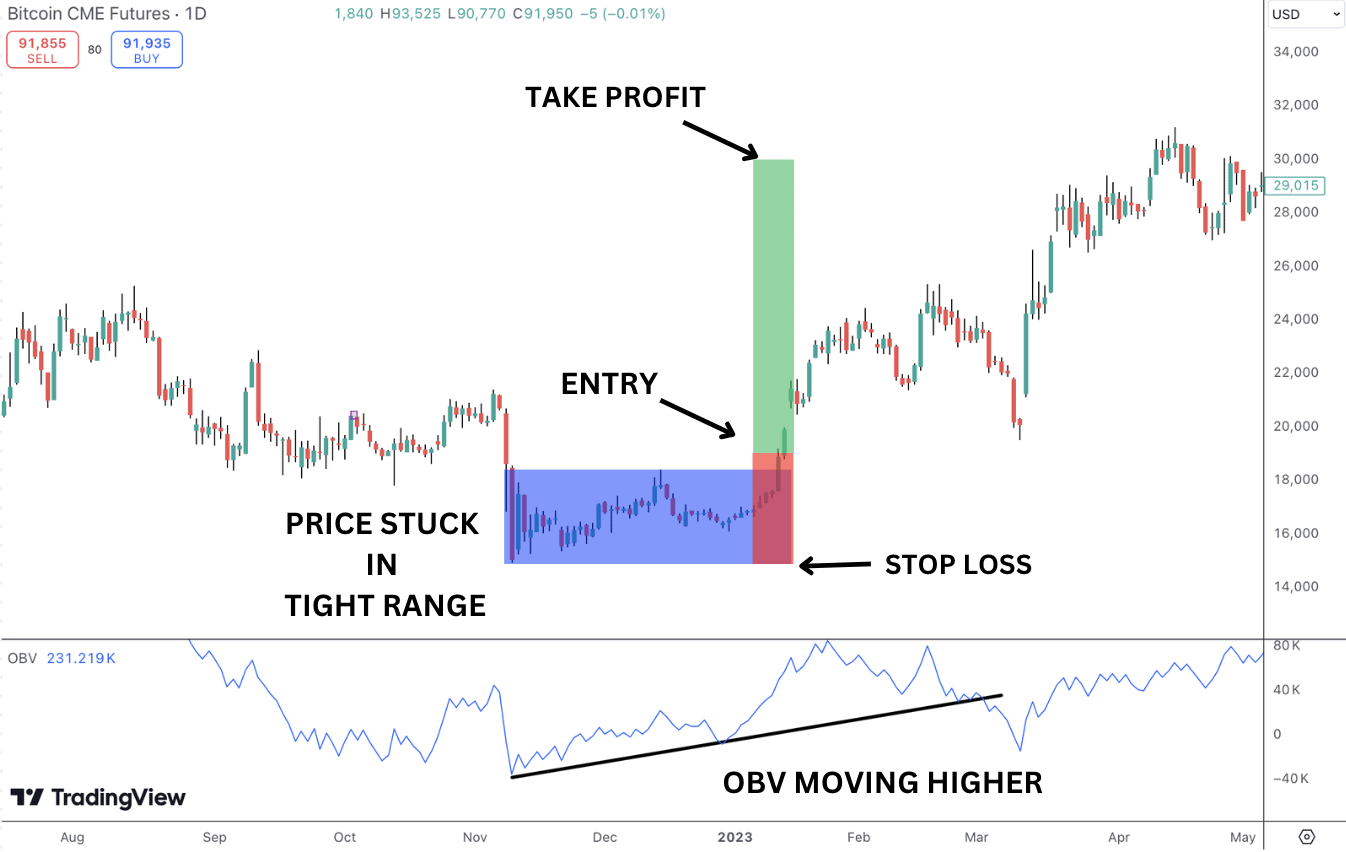
Price is stuck in a sideways range following a sell off. However, we can see the On Balance Volume line is moving higher, suggesting to us a breakout higher is likely. We can enter long as price breaks above the range highs, with OBV moving higher confirming the signal.
- Distribution: A falling On Balance Volume during a period of stable or slightly rising prices suggests that market players are selling off their positions (distributing) while retail investors may be buying, potentially signaling an upcoming price decline.
In the chart below, we can see an example of distribution happening in copper.
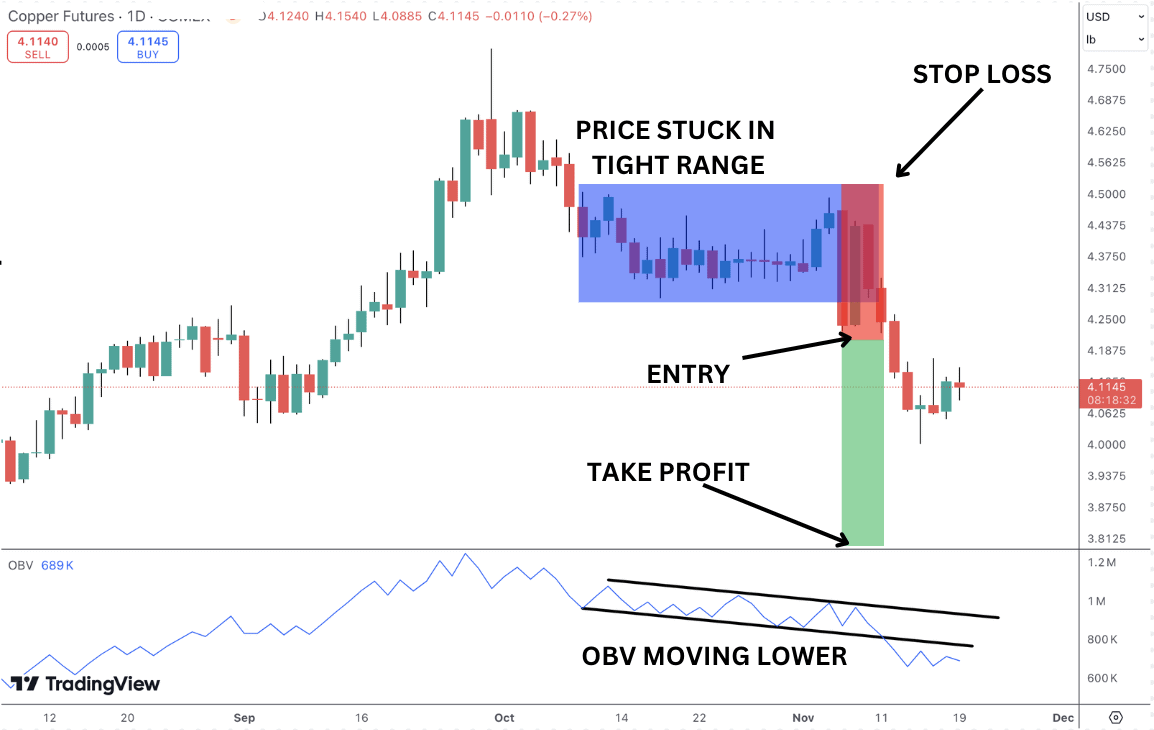
Price is trading in a sideways range, highlighted by the blue box. However, you can see that OBV is trending lower, moving in a bearish channel. This signals to us that price is likely to resolve lower out of the range, offering a selling opportunity as the market eventually breaks lower.
Advantages of On Balance Volume
- Volume Confirmation: OBV helps confirm price trends by showing whether volume supports the price movement. A rising OBV suggests strong buying interest, while a falling OBV indicates selling pressure, providing insights into market strength.
- Early Detection of Reversals: OBV can indicate potential reversals before price action fully reflects them. Divergences between OBV and price (e.g., OBV rising while price falls) can suggest a weakening trend and signal an upcoming reversal.
- Simplicity and Ease of Use: OBV is easy to calculate and interpret, as it’s based on simple volume and price data. It’s a straightforward tool that traders can use to spot volume trends and make informed trading decisions.
Disadvantages of The On Balance Volume
- Lack of Precision: OBV is a cumulative indicator, meaning it only tracks the overall flow of volume and doesn’t provide detailed information about price action or volume fluctuations. This can lead to less precise signals and a reliance on other indicators for confirmation.
- False Signals in Sideways Markets: OBV can give misleading signals during periods of consolidation or sideways movement. In such conditions, OBV may oscillate without offering clear trend directions, leading to potential false breakouts or breakdowns.
Not Suitable for Day Trading
The On Balance Volume indicator is not ideal for day trading because large orders entering the market will have already moved prices resulting in delayed signals. Where as, when you view OBV on a longer-time scale, the accumulation will show up in the stock price. Its effectiveness is reduced on short timeframes since it smooths volume trends, which may not provide the precision needed for quick, intraday decisions.
Additionally, OBV can give false signals during periods of low volume or market consolidation, common in day trading, where rapid price fluctuations and changing volumes demand more responsive indicators.
False Signals
One of the key criticisms of the on balance volume indicator is that it is vulnerable to giving false signals. However, if traders can make themselves aware of the conditions in which false signals typically appear, they can manage their trading accordingly.
OBV tends to give false signals in the following situations:
- Low Volume or Thinly Traded Markets: In low-volume markets, small trades can have an exaggerated impact on OBV, creating misleading signals that don’t reflect true buying or selling strength.
- Sideways or Consolidating Markets: When price is moving sideways, OBV may fluctuate without a clear direction, giving misleading signals that suggest a trend change when there isn’t one.
- Large Block Trades or Unusual Volume Spikes: Unusually large trades (like institutional orders) or sudden spikes in volume due to news events can cause OBV to jump, which might falsely indicate a trend shift. These one-time volume spikes can distort OBV without an actual trend change.
Applicability Across Markets
One of the most appealing aspects of the OBV indicator is that it can be used across all asset classes and markets. However, there are some provisions traders should be aware of.
OBV performs best in markets with reliable, transparent volume data.
In stocks and commodities, where volume is consistently reported, OBV effectively confirms trends and reversals.
Due to the decentralized nature of forex, true volume can be found only with each brokerage and can be tough to piece together as an industry. As a result, traders often use tick volume as a proxy, though it can lead to unreliable signals.
Like forex brokers, cryptocurrency exchanges are decentralized. OBV can highlight volume trends but false signals may appear during low liquidity or high volatility.
Generally, OBV works well in centralized markets and should be used with caution in decentralized or volatile markets.
How Does On-Balance-Volume Differ From Other Types of Volume Oscillators?
The key difference which makes the OBV standout from other volume indicators is the emphasis on a cumulative volume total.
Unlike indicators like Volume Oscillator or Chaikin Money Flow that use specific volume periods to show short-term shifts, OBV continuously adds or subtracts volume based on whether the price closes higher or lower. This cumulative approach helps OBV reflect longer-term volume trends and give a more useful overall reading of the market.
On Balance Volume vs Accumulation/Distribution
On Balance Volume and Accumulation/Distribution (A/D) are both volume-based indicators, but they differ in how they incorporate price and volume data to gauge buying and selling pressure. Here’s a comparison:
OBV adds or subtracts the entire volume of a trading day to the previous total based on whether the closing price is higher or lower than the previous close. If price closes up, OBV adds that day’s volume; if it closes down, OBV subtracts it. This creates a cumulative volume flow that emphasizes price direction.
Accumulation/Distribution uses a more nuanced approach by weighting the daily volume based on the position of the closing price within the day’s range (high to low). If the price closes near the high, it indicates accumulation (buying); if near the low, it indicates distribution (selling). This calculation reflects not just price direction but also the intensity of the buying or selling.
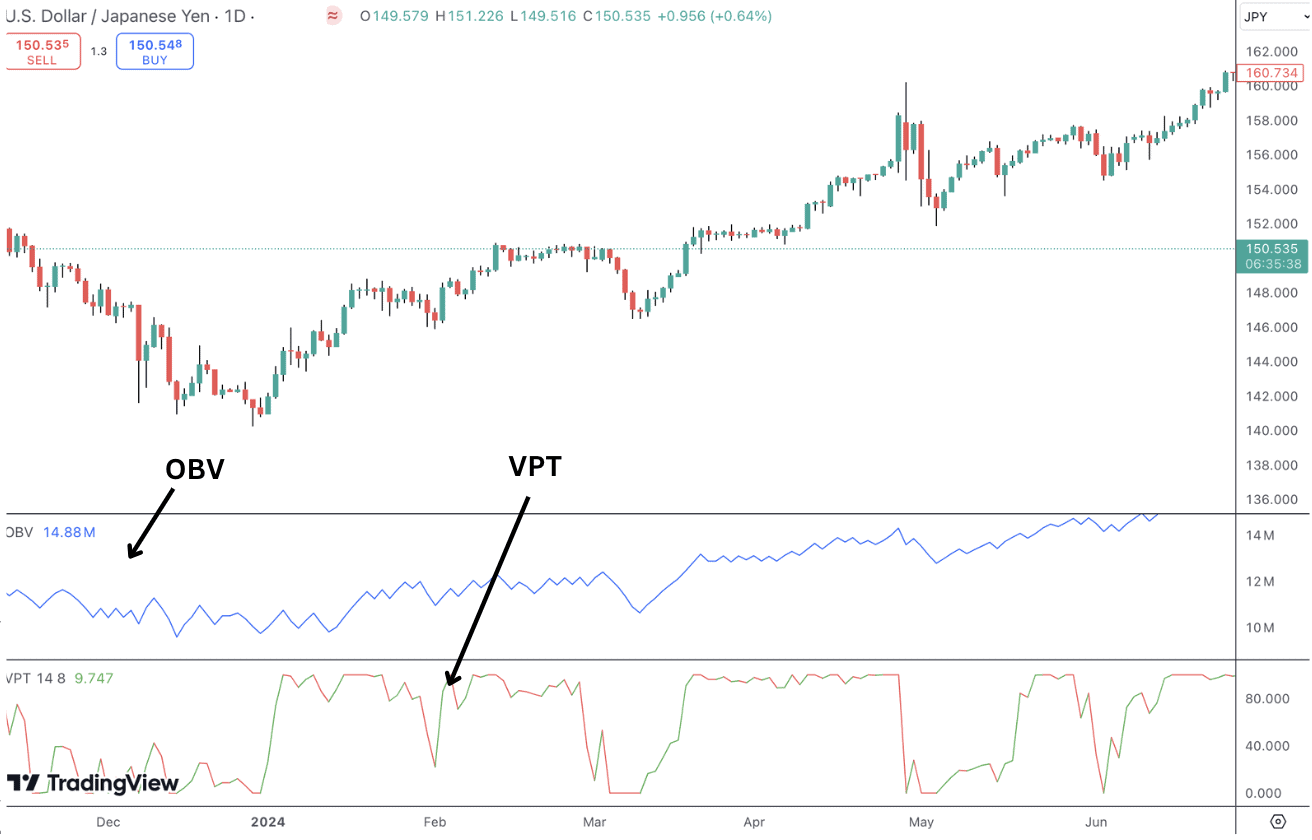
On Balance Volume vs Volume Price Trend
On Balance Volume and VPT (Volume Price Trend) are both volume-based indicators but differ in their approach. OBV adds or subtracts daily volume based solely on whether the price closes higher or lower, creating a simple cumulative measure of buying or selling pressure.
In contrast, VPT adjusts volume by the percentage change in price, making it more sensitive to price movement intensity. While OBV provides a broad view of volume flow and is useful for identifying trend confirmation or divergence, VPT offers a more detailed look at trend strength by weighting volume according to price changes. This makes OBV better for tracking general trends, while VPT is often more precise in capturing strong momentum shifts.
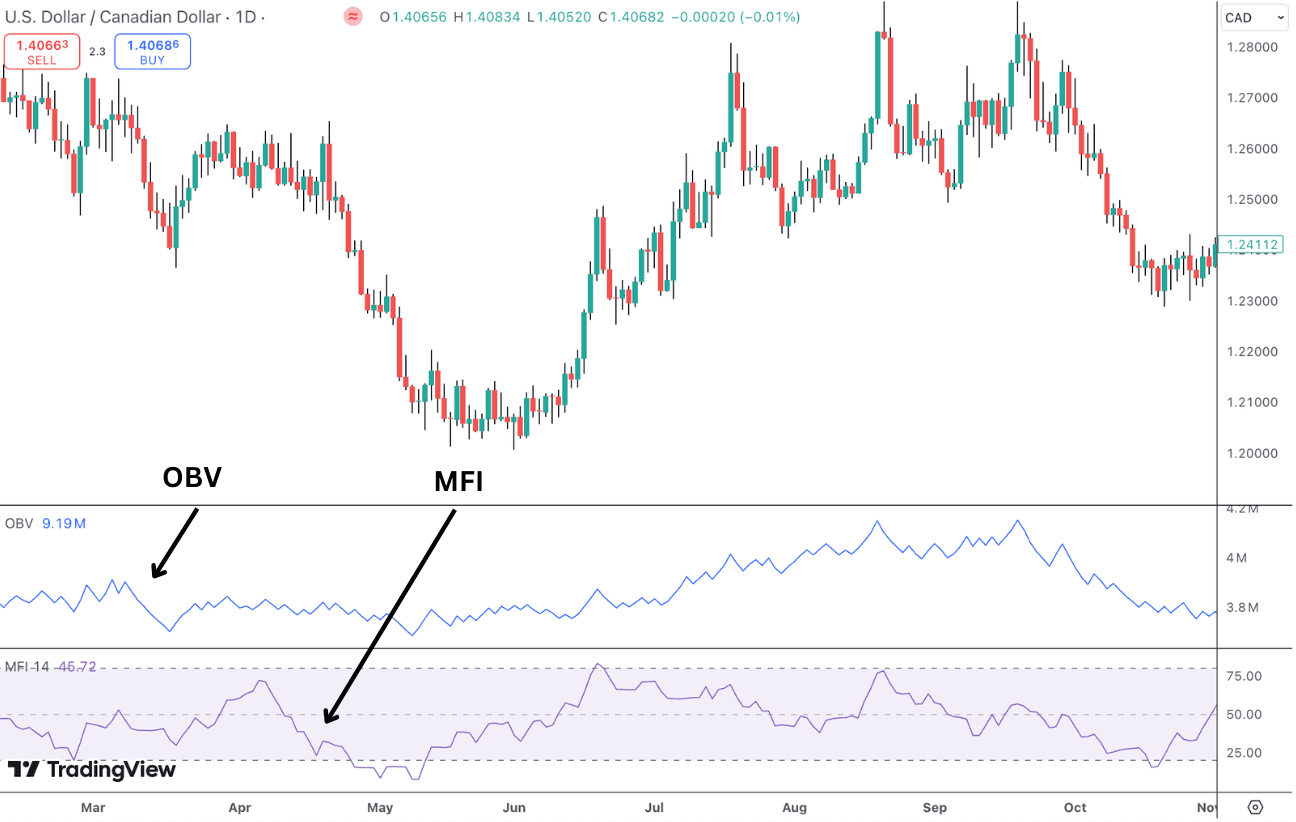
On Balance Volume vs Money Flow Index
On Balance Volume and the Money Flow Index (MFI) are both volume-based indicators but differ in focus. OBV measures cumulative volume flow based on whether the price closes higher or lower, making it useful for trend confirmation and spotting divergences. Importantly, there is no upper limit for OBV so it’s less a case of monitoring extreme readings but more a case of tracking direction.
In contrast, MFI combines price and volume to act as a “volume-weighted RSI,” ranging from 0 to 100 to indicate overbought (above 80) or oversold (below 20) conditions.
While OBV is better suited for confirming long-term trends, MFI is more sensitive in shorter timeframes, making it ideal for identifying quick momentum shifts.
Below we can see the two indicators on a price chart, note the difference in the way the two indicators are presented and the difference in the readings given.
How On Balance Volume Can be Modified
The original OBV contains no input values and is simply to apply to the charts. Therefore, traders look for a way to improve on the indicator.
On-Balance Volume (OBV) Modified is an upgraded version of the classic On-Balance Volume (OBV) indicator. The Modified OBV adjusts the traditional OBV to overcome some of its limitations or to fit specific trading strategies. The modifications can be many but here are six examples:
1. Moving Averages
- Instead of using raw OBV values, traders modify OBV by apply moving averages (e.g., SMA or EMA) to the OBV line to smooth out the noise and get clearer trends.
- Crossovers between the OBV line and its moving average can be a trading signal.
- See our section above on OBV with Moving Averages
2. Weighting Volume by Price Change
- In traditional OBV, the volume for the day is added or subtracted in total based on whether the close is higher or lower than the previous day.
- In the modified OBV version, volume might be weighted by the price change, so days with bigger price moves get more weight.
3. Scaling or Normalizing OBV
- To compare OBV across different instruments or timeframes, the OBV value can be normalized or scaled (e.g., as a percentage or relative to the average volume).
4. Using Relative Volume
- Instead of using raw volume, traders might use relative volume (e.g., volume as a multiple of the average volume over a certain period) in the OBV calculation. This will highlight big volume surges compared to the instrument’s normal.
5. Filtering Minor Price Changes
- To reduce noise, some modified OBV calculations ignore minor price changes. For example, only adding/subtracting volume when the price change is above a certain percentage or threshold.
6. Multi-Timeframe OBV
- A modified OBV might combine volume data from multiple timeframes (e.g., daily and weekly OBV) to get a bigger picture of volume trends.
FAQ
Which is the best time to trade using On-Balance-Volume (OBV)?
Generally, OBV is more reliable during higher volume sessions, as it better reflects market sentiment and trader participation. For stocks, the first and last hours of the trading day (9:30-10:30 AM and 3:00-4:00 PM ET) tend to see the most volume, making these ideal times to use OBV for trading signals. In the forex market, the overlap between the London and New York sessions (8:00 AM to 12:00 PM ET) typically has the highest volume, providing a favorable window for OBV-based trading strategies.
What is The philosophy behind on-balance volume indicator
The philosophy behind the On Balance Volume is that volume precedes price—meaning that shifts in trading volume often lead to price changes. OBV is based on the idea that when a security’s price is about to move significantly, volume will increase before the actual price movement, reflecting changes in sentiment among large institutional investors and traders.
There are two key principles in using OBV to analyse markets:
- Volume as an Indicator of Strength: OBV suggests that an increase in volume without a corresponding change in price indicates strength in the current price trend. For instance, if OBV rises while price stays flat or increases slightly, it’s interpreted as a sign that “smart money” is accumulating, potentially signaling an impending price rise.
- Accumulation and Distribution: OBV divides volume into “accumulation” (buying pressure) and “distribution” (selling pressure). When OBV increases, it suggests net buying, while a declining OBV indicates net selling. By observing these patterns, traders look for signs of accumulation (buyers quietly building positions) or distribution (sellers gradually offloading shares), both of which can foreshadow price reversals.
Is On-Balance-Volume (OBV) an oscillator?
In short, no, On Balance Volume is not technically an oscillator. Unlike oscillators, which fluctuate within a bounded range (like the RSI moving between 0 and 100), OBV is an accumulative indicator that continually adds or subtracts volume based on daily price changes, creating a running total. This running total can increase or decrease indefinitely as it tracks cumulative buying and selling pressure over time.
How reliable is On Balance Volume?
The reliability of the On Balance Volume indicator depends on market conditions, the asset type, and how it is used within a broader strategy. While OBV can provide valuable insights, especially when combined with other technical indicators and analysis methods, it has some limitations in reliability on its own.
Market Trend and Volume Conditions:
- OBV tends to be more reliable in trending markets where there’s strong buying or selling pressure and less effective in choppy or sideways markets.
- In low-volume conditions, OBV’s signals can be misleading because it may reflect only minor price fluctuations or trades, which don’t indicate true market sentiment or strength.
Is On Balance Volume a Leading or Lagging Indicator?
OBV is considered a leading indicator as it looks to signal future price movements by analyzing volume trends, based on the idea that volume often precedes price. OBV aims to predict price direction by identifying changes in buying or selling pressure before they appear in price action.
For example, a rising OBV alongside a flat price might indicate accumulation, suggesting an upcoming price increase, while OBV divergences can signal potential trend reversals. Although OBV can provide early signals, it’s best used in combination with other indicators for added reliability, as volume shifts alone may not always indicate sustained trends.
What is the origin of On Balance Volume
The On Balance Volume indicator was developed by Joseph Granville in the early 1960s. Granville, a financial analyst and market technician, introduced OBV in his 1963 book Granville’s New Key to Stock Market Profits. His goal was to create a volume-based indicator that could predict price movements based on the relationship between volume and price.
Is On-Balance Volume the Same As Volume?
Volume and On Balance Volume are similar technical indicators but not exactly the same. Volume measures the raw trading activity of an asset, typically displayed as a histogram, without indicating direction. OBV, on the other hand, is a cumulative indicator that adds or subtracts volume based on whether the price closes higher or lower for each session, showing buying or selling pressure. While volume reflects market activity, OBV interprets it in the context of price movement, making it useful for identifying trends, divergences, and shifts in market sentiment.
Which volume indicator is best?
OBV is ideal for spotting trends and divergences, while VWAP is popular for intraday trading and identifying fair value. Accumulation/Distribution (A/D) and Chaikin Money Flow (CMF) help assess buying or selling pressure, with CMF offering momentum insights. Volume Oscillator and Relative Volume (RVOL) are great for confirming breakouts and gauging unusual activity. Intraday traders often prefer VWAP and RVOL, trend traders benefit from OBV or A/D, and breakout or momentum traders rely on CMF or Volume Oscillator. The best advice is to try some different indicators out and see which suit your trading style best and remember, combining volume indicators with other tools typically enhances reliability.