- Elliott Wave
- January 10, 2025
- 2min read
Pound’s Leaner Look: Is It Fit to Rebound? [GBP/USD Elliott Wave]
Executive Summary
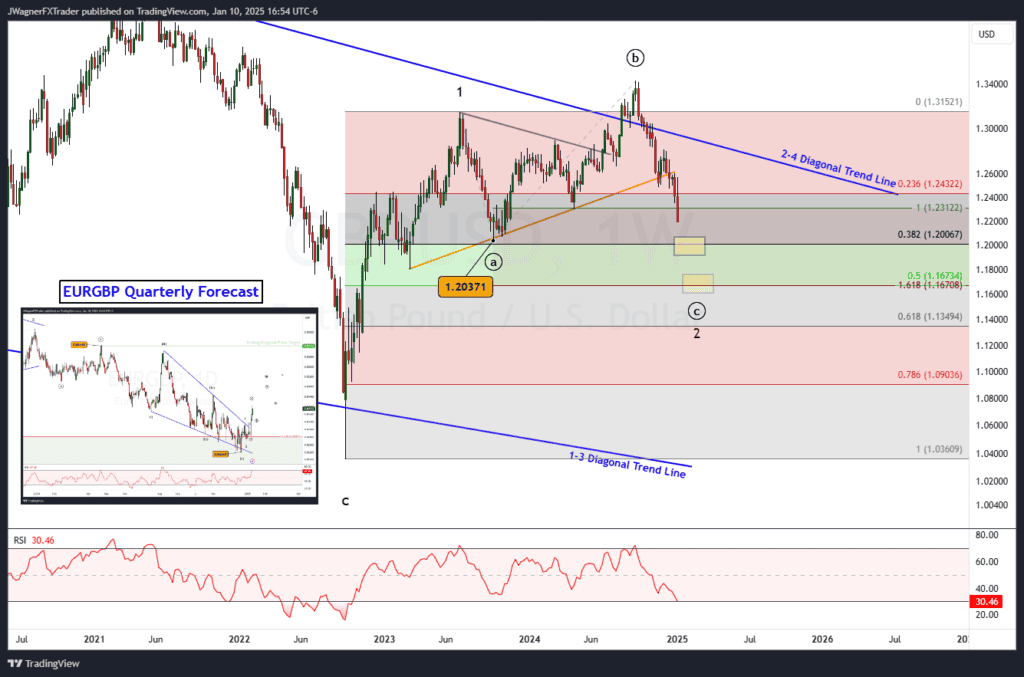
- GBPUSD is declining in wave ((c)) of 2
- Bearish targets include 1.2000 and 1.1670
- The forecast remains valid so long as price remains below 1.2576
Current GBPUSD Elliott Wave Count

The current Elliott wave count for GBPUSD on the daily chart is that prices are in the late stages of wave ((c)) of 2. Wave 2 would be a large flat pattern that began at the end of wave 1 on July 2023. This pattern has progressed for 18 months and has only retraced approximately 38% of wave 1. This is common behaviour for a flat pattern to take time to carve while correcting narrowly in price.
Downside Targets
We can estimate some downside targets of this large pattern based on some market geometry.
The first target is around 1.2000 with another lower target near 1.1670.
The first target of 1.2000 contains the 38.2% Fibonacci retracement level of wave 1 plus the swing low of wave ((a)).
If prices continue to fall aggressively below 1.2000, then the next target is near 1.1670.
The second target is guarded by the 50% Fibonacci retracement level plus the 1.618 Fibonacci extension where wave ((c)) is 1.618 times the length of wave ((a)).
When assessing the EUR/GBP cross pair, it appears GBP would be relatively weaker than EUR as we are anticipating a strong rally in EUR/GBP. So GBPUSD may fall faster and harder than EURUSD. Or, GBPUSD may not rally as fast as EURUSD. We mentioned this in our Q1 2025 Forex Forecast.
Bottom Line
GBPUSD is in the latter part of a wave 2 decline that could carry down to 1.2000 or 1.1670. This forecast remains in force so long as current prices remain below the January 7 high of 1.2576.
You might also be interested in:


