


Written by:

- Chart of the Day
- September 18, 2024
- 3 min read
Is it a Bull Trap: S&P 500 Retesting All-Time Highs
As we reapproach the all-time highs on S&P 500, the idea of a Fed Pivot is looming over each and every traders’ head.
Is this potentially a setup for the big players to massively short-sell, catching the overly bullish retail traders with their pants down?
With the interest rate announcement coming up today, the markets are expecting a cut between 25bps – 50bps.
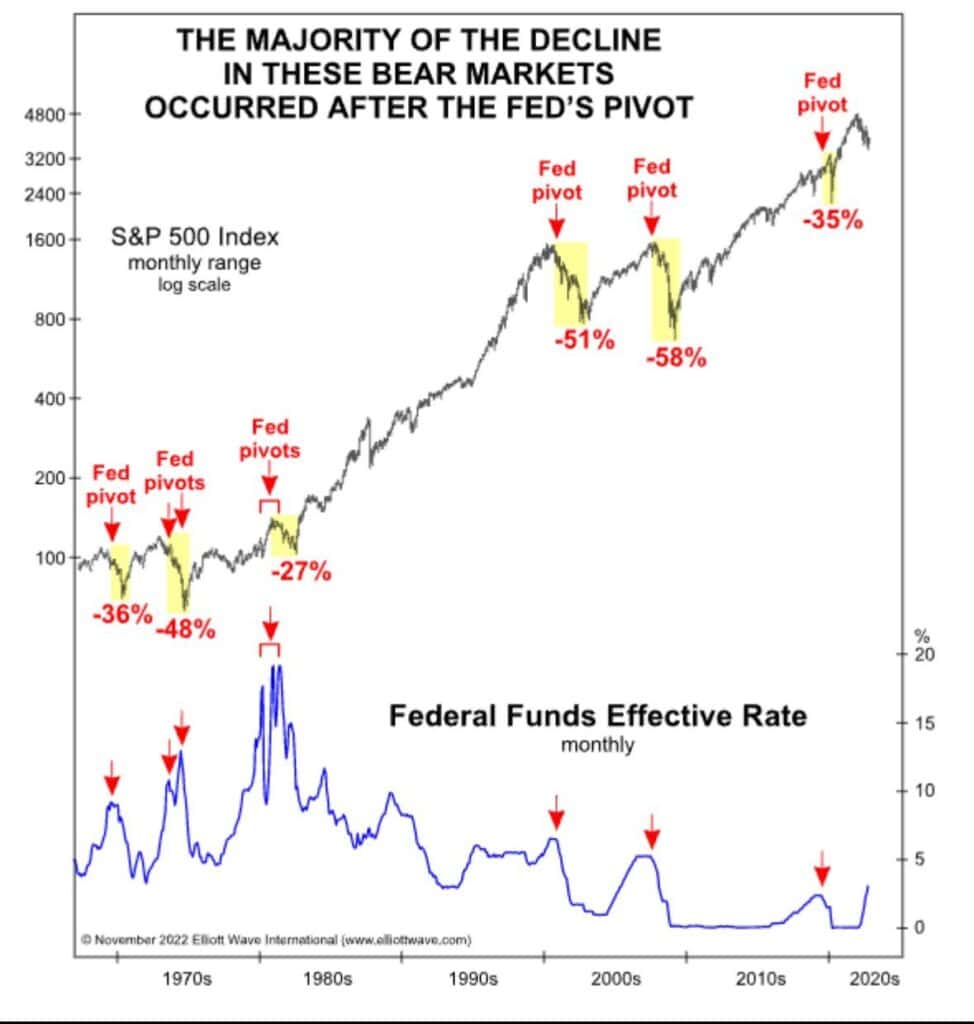
Whilst this is inherently bearish for the U.S Dollar, and should by right lift up the price of assets weighed against it, like the S&P – the rate cut is also a response to recession. Given the Fed Pivot’s infamous history of leading to a price drop days or weeks after the decision, we should proceed with caution here.
Weekly Chart of S&P 500
The weekly chart of S&P 500 paints a picture of a broadening wedge towards the upside, with the trendline projecting a $6,000 price target by the end of October.
Furthermore, a bearish weekly RSI divergence paints a picture of a reversal to come. When you pair these signs with the knowledge of how Fed Pivots tend to play out, the current price action of S&P 500 is potentially a warning for a BULL TRAP!
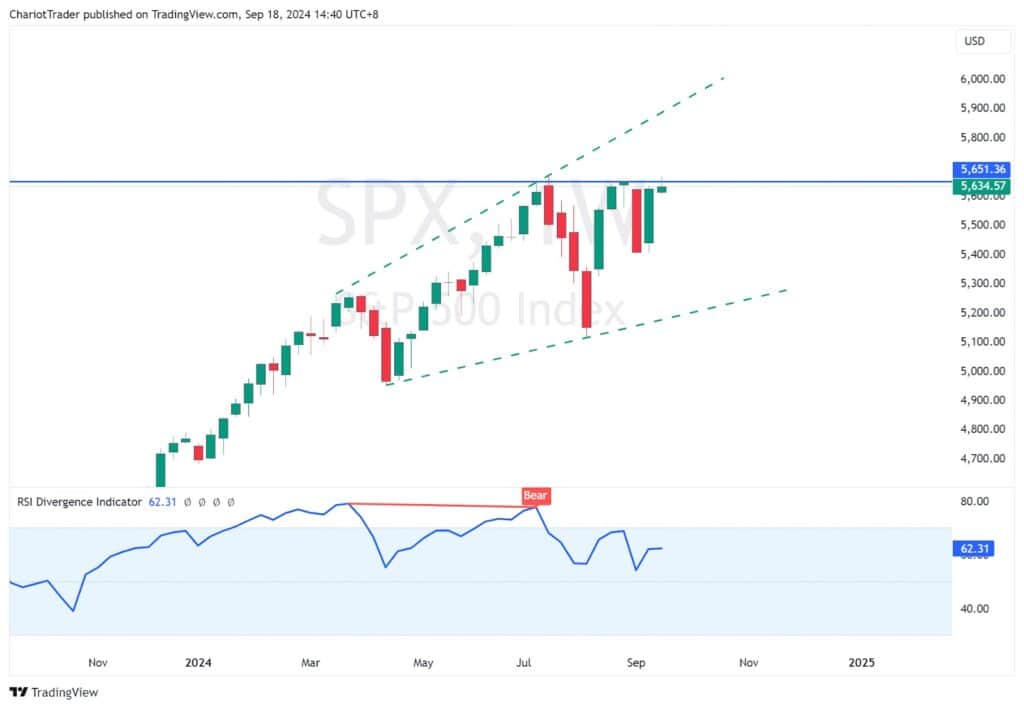
That being said, the asset is still technically in an uptrend, and has recently seen an amazing recovery from approximately $5,400, reached two weeks ago.
Currently, it is struggling with a resistance zone formed by its All-Time High at approximately $5,671.17 and also formed by a hanging man candlestick pattern (Bearish reversal signal).
However, if the price of S&P 500 does push higher, we’d have to worry about the weekly bearish divergence becoming more prominent.
Hourly Chart of S&P 500
Currently on the 1-hour timeframe, the S&P 500 is grinding on the EMA 20, which is currently above the EMA 50.
Whenever these conditions are met, the S&P 500 has been able to stay above the EMA 20, until eventually it breaks the EMA50 and begins a small descent.
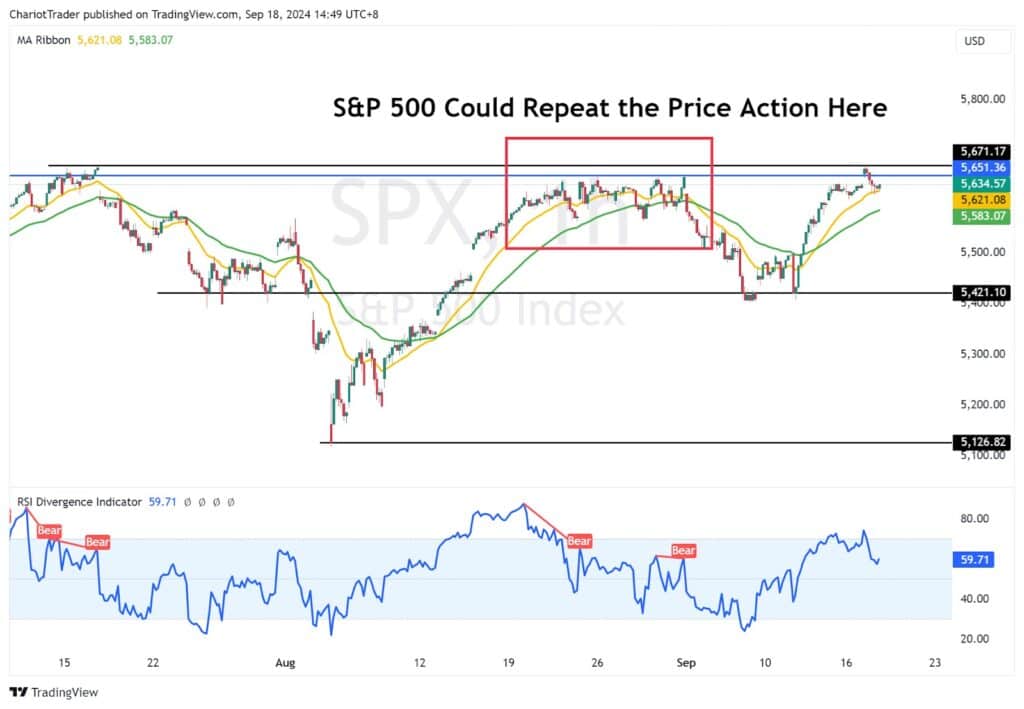
Since these are our current market conditions, we could watch a potential similar scenario to occur. In such a scenario, the S&P 500 could reach the following levels:
- Previous Support Zone at approx. $5,421.10
- Major Pivot Low at approx. $5,126.82
- Psychological level at $5,000
In the event that the Fed pivot does bring major downside, which has happened before with the range of 27% to 58%, we could revisit levels as low as $4,000 – approximately a 29% drop.
Either way, we’re in a make it or break it zone. If the S&P 500 does manage to climb higher, it’s possible for Wave 3 of the S&P 500 rise to come into fruition.
This analysis offers an alternative scenario to the bullish scenario.
You may also be interested in:
Fed Rate Cut on the Horizon: Will the S&P 500 Wave 3 Ride Breakout or Bounce?


