


Written by:

- Chart of the Day
- September 9, 2024
- 4 min read
Gold’s Bullish Rally: A Strategic Look at its Momentum
Gold continues to glitter as one of the top-performing commodities in 2024, and it shows no sign of slowing down. This precious metal is riding the wave of favourable economic conditions and geopolitical uncertainties. The gold market remains bullish, especially with the imminent US interest rate cuts and robust central bank demand. Let’s dive into why the rally is far from over and how gold could reach new record highs in the coming months.
Why Gold is Primed for Further Gains
Anticipated U.S. Interest Rate Cuts: The Federal Reserve’s upcoming policy shift is a major driver of gold’s recent performance. Following Fed Chair Jerome Powell’s remarks at the Jackson Hole conference, markets expect an interest rate cut, likely by 50 basis points (bp). Lower rates diminish the opportunity cost of holding non-yielding assets like gold, making it a more attractive investment. Gold’s current rally has already gained momentum from this anticipation, and the actual rate cuts will likely push prices even higher.
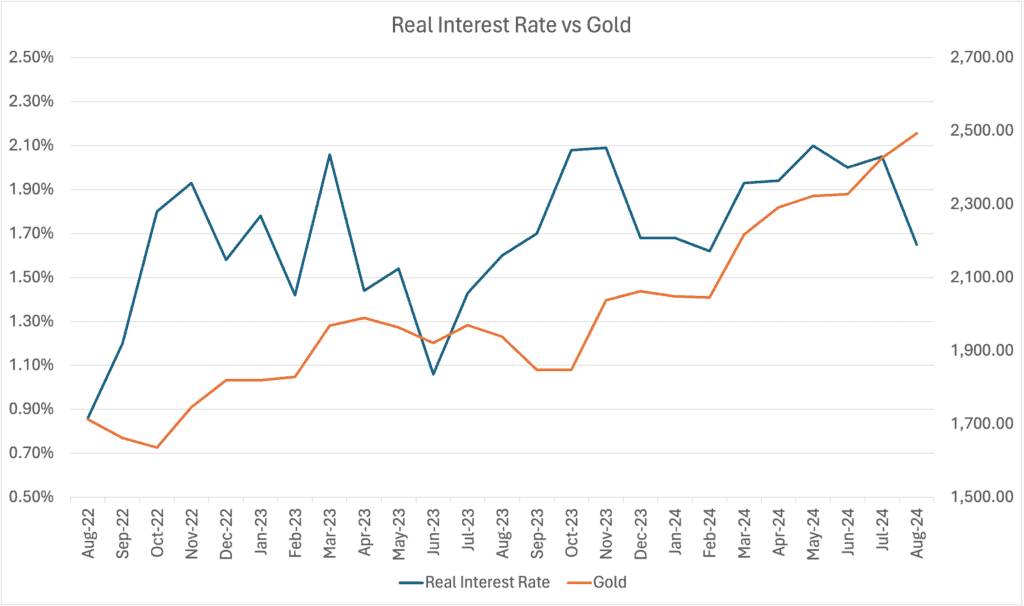
This chart illustrates the inverse relationship between real interest rates and gold prices. As real interest rates decrease, gold tends to rise due to its appeal as a non-yielding asset. The recent dip in interest rates in 2024 aligns with the steady increase in gold prices, reinforcing gold’s role as a safe-haven investment during periods of economic uncertainty.
Definition: The real interest rate is the interest rate adjusted for inflation. It represents the true cost of borrowing and the real return on savings, reflecting the purchasing power of money. When real interest rates are low or negative, assets like gold, which do not offer interest, become more attractive to investors, leading to higher demand and rising prices.
Central Bank Demand: Central banks worldwide are stepping up their gold purchases, reflecting a broader strategy to diversify reserves amid economic uncertainty. In July 2024 alone, central bank net purchases surged to 37 tonnes, marking a 206% increase from the previous month. Nations like Poland, Uzbekistan, and India are leading this gold-buying spree. This consistent demand not only supports current prices but also provides a long-term bullish outlook.
Geopolitical Uncertainty: Heightened geopolitical risks, including the ongoing conflict in Ukraine, U.S.-China tensions, and Middle Eastern instability, are bolstering gold’s status as a safe-haven asset. With a US presidential election around the corner, uncertainty is high, and this should continue to support gold prices in the near future.
Technical Analysis
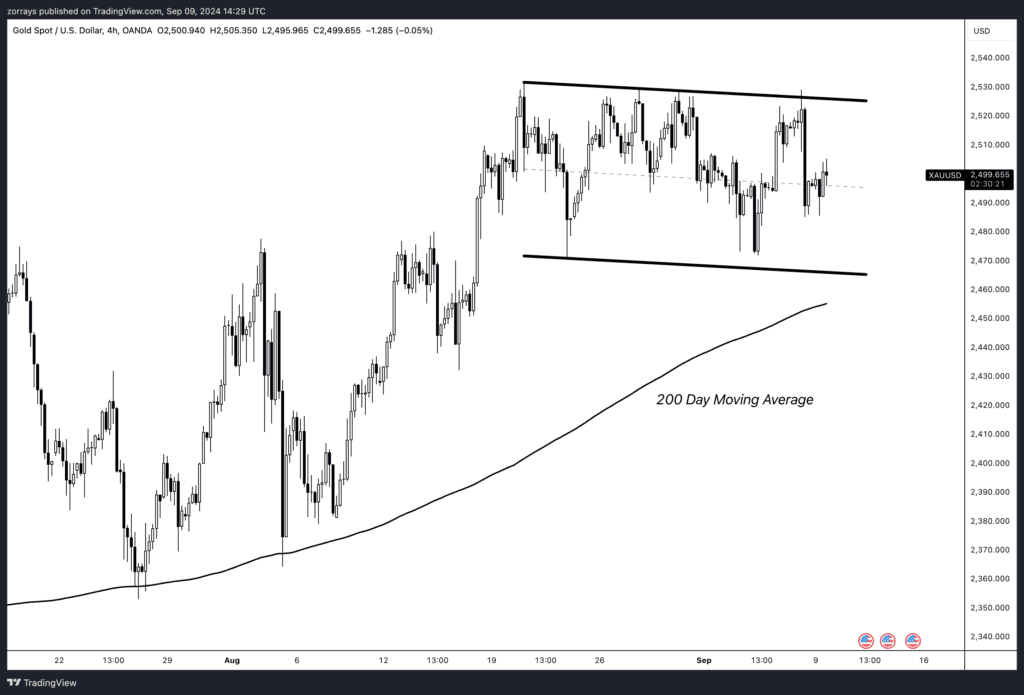
Gold prices are currently consolidating within a bull flag pattern, which is typically a bullish continuation setup. After the strong upward momentum seen in August, the market has entered a period of consolidation within a narrow range. This pattern suggests a high probability of an upside breakout, continuing the broader upward trend.
- Bull Flag Pattern:
- A bull flag forms when price experiences a sharp rise (the “flagpole”) followed by a brief period of consolidation in a downward-sloping channel. This pattern is considered bullish, as it signals that the previous upward momentum is likely to continue once the price breaks out of the consolidation range.
- In this case, the price is hovering just under $2,500 within the flag. A confirmed breakout above the upper boundary of the flag would target the key resistance level at $2,530.
- 200-Day Moving Average Support:
- Importantly, gold has remained consistently above the 200-day moving average, a long-term trend indicator that acts as dynamic support. This reinforces the bullish outlook, as the price’s position above this key moving average suggests sustained buyer interest and market confidence.
- The proximity of the 200-day moving average near $2,430 provides a strong base, ensuring that any short-term dips are likely to be met with buying interest.
- Key Resistance at $2,530:
- The critical level to watch is $2,530, which serves as a key resistance zone. A breakout above this level would confirm the end of the consolidation phase and potentially open the door for a continued rally towards new highs.
- Traders should monitor volume closely on any move towards $2,530. Increased volume during an upward breakout would confirm the strength of the bull flag, making a case for further upside momentum.
Conclusion:
With gold prices supported by the 200-day moving average and forming a bull flag pattern, the technical outlook remains bullish. A breakout above the $2,530 resistance level would signal a continuation of the uptrend, potentially pushing prices towards new highs. Investors and traders should keep a close eye on how the price reacts around this key level, as it will determine the next leg of gold’s movement.
This scenario aligns with the broader bullish sentiment, supported by macroeconomic factors such as anticipated Fed rate cuts and strong central bank demand, as discussed earlier.


