


- Elliott Wave
- October 28, 2025
- 2 min read
EUR/USD Elliott Wave: Dueling Central Bank Rate Announcements
Executive Summary
- Wave B of (2) topped at 1.1918.
- Wave C or Y of (2) decline to 1.12 – 1.1391 and possibly lower levels.
- 1.1918 is the bearish key level, a bullish break would consider a triangle pattern
On Wednesday, the FOMC concludes their 2-day meeting with their latest interest rate announcement. The next day, Thursday, ECB is expected to hold rates steady. The consolidation of EUR/USD prices implies an eventual break higher. However, EURUSD is currently capped by a 3-year parallel price channel suggested gains are limited until a deeper consolidation in price or time has appeared.
Current Elliott Wave Analysis
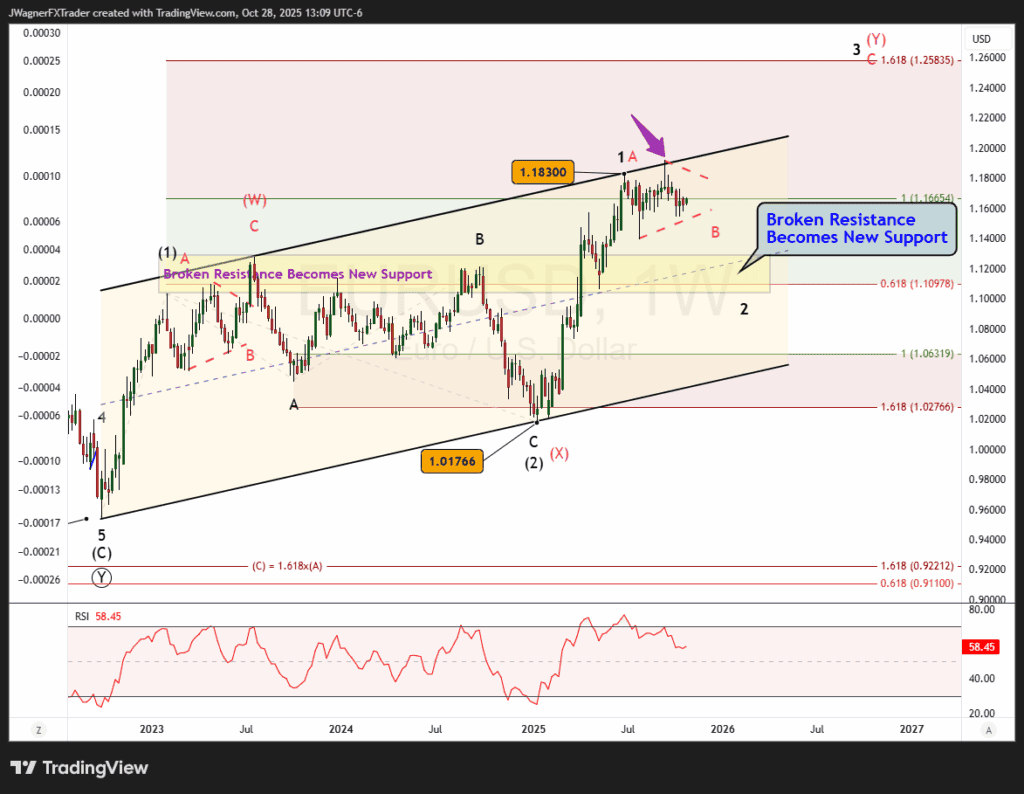
The last Fed meeting, September 17, was a 25 basis point rate reduction that caused a spike higher in EURUSD. The high price that day has since held below 1.1918.
The sideways price action in EURUSD since July 1 suggests it is a consolidation of the H1 2025 uptrend. The preferred Elliott wave count I’m following is that a decline is forthcoming in wave ((y)) of 2. This would imply a decline to 1.12-1.1391.
There is an alternate count that I’m slowly giving more attention to. The July 1 consolidation is beginning to appear like a triangle pattern. The challenge if this does become a triangle is how it fits within the larger wave picture. The best scenario I can find is if we change the rally from 2022 to a (W)-(X)-(Y) double zigzag. That would make the current symmetrical triangle from July 1 wave B of (Y).
However, the yellow parallel price channel has been holding down EURUSD pricing. Therefore, if this triangle does terminate in a couple of weeks, the upside may be limited to the top of the channel. The upper bound of the price channel currently crosses by near 1.1970.
Bottom Line
The preferred Elliott wave count we are following is that a wave 2 decline is still underway and may reach 1.12-1.1391.
The alternate count calls for continued sideways grind in a triangle pattern that leads to a bullish breakout.
A break below 1.1391 will confirm the former, while a break above 1.1918 confirms that latter bullish view.


