
- Elliott Wave
- October 23, 2025
- 2 min read
GBP/USD Elliott Wave: Another Leg Down
Executive Summary
- GBPUSD continues its decline in the 2nd leg of a double zigzag pattern.
- Though a rally to 1.3550 would be considered ‘normal’, the larger trend is down.
- Downside targets include 1.3050-1.3139.
Back on September 19, two-days after a medium term top, we forecasted a decline in GBPUSD reaching to 1.31 and possibly 1.28. Cable has progressed lower and the Elliott wave pattern appears to be incomplete to the downside.
GBPUSD Elliott Wave Count
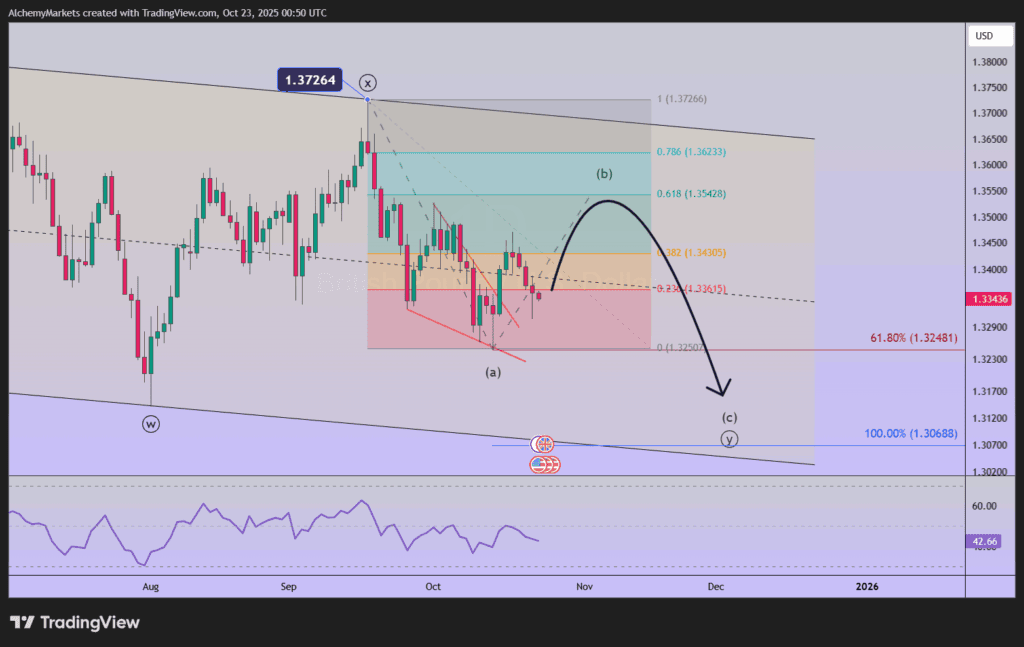
GBPUSD carved a wave ((x)) high on September 17 at 1.3726. The decline since September 17 fits best as wave ((y)).
We know from our Elliott wave studies that this y-wave is likely to take shape as an (a)-(b)-(c) zigzag pattern.
It appears Cable is about half-way through the wave (b). It is possible GBPUSD may rally further up to 1.3550 to complete (b). Then, the next wave, wave (c) would be a motive pattern that likely digs down to 1.31 and possibly lower levels.
There are a few wave relationships appearing between 1.3050 – 1.3139 so we’ll need to see how advanced the wave structure is if price is successful in reaching down that low.
The key level to the bearish forecast is 1.3726. If GBPUSD rallies above this level, then we’ll need to reconsider a different Elliott wave pattern at play.
Bottom Line
GBPUSD appears to be about halfway through its next leg lower. A rally to 1.3550 would be considered ‘normal’ within the Elliott wave structure we are following. However, the trend is still lower and the next trend may dig deeper to 1.3050-1.3139.
If 1.3726 is breached to the upside, then we’ll reconsider the wave count.