


- Elliott Wave
- June 27, 2025
- 2 min read
SP500 Elliott Wave: Retest All-Time Highs
Executive Summary
- Bullish Trend: SPX is retesting all-time highs at 6,151.
- Key Support: 5,767 level is the support zone of a decline that may develop.
- Wave Count: Still no sight of wave 4 decline.
Current Elliott Wave Analysis
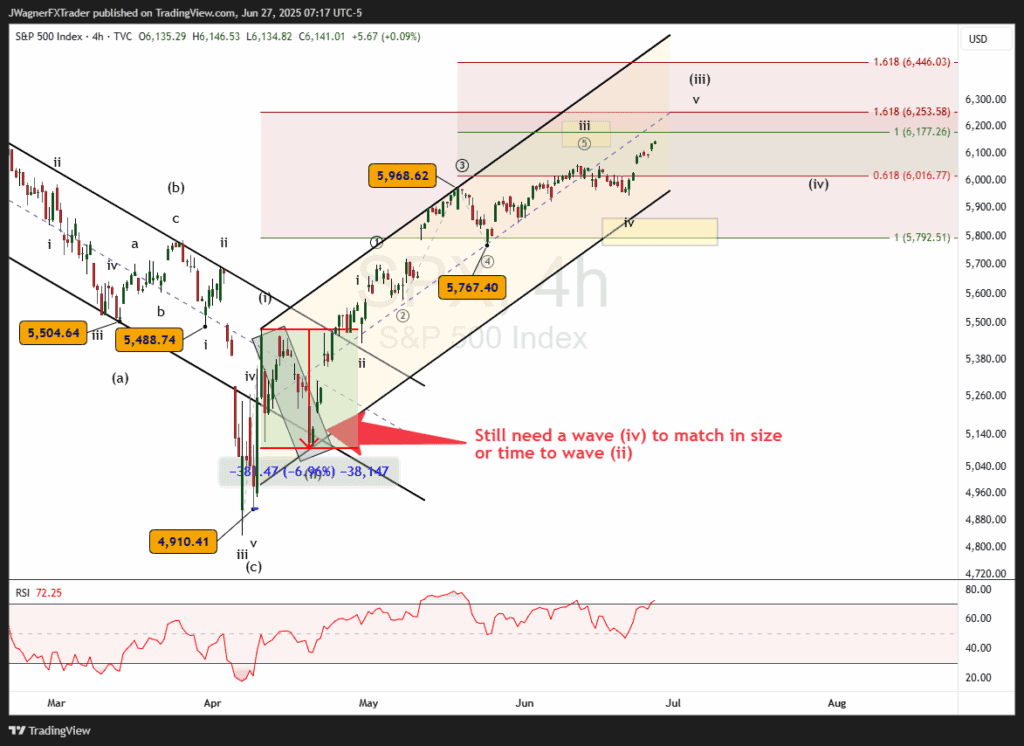
The SPX chart follows an incomplete Elliott Wave impulse pattern as the market climbs in wave (iii).
Back on May 15, while trading at $5,900, we forecasted a rally to retest the all-time high at $6,151. Now that we have arrived at $6,151, what is next?
It appears the market is still rallying in an extended 3rd wave labeled (iii).
The biggest clue to that assessment is that wave (ii) experienced a 7% decline back in April. Wave (iv) is a cousin wave to (ii), meaning they should have similar depths. It doesn’t have to be exact, but a 5-7% decline would suffice and offer evidence of wave (iv).
Until a decline of that amount appears, wave (iii) may continue to extend higher.
The current all-time high at $6,151 may create a bearish reaction. Don’t be surprised if a breakout above $6,151 creates FOMO and additional panic buying.
Bottom Line
SPX remains in a strong bullish uptrend labeled wave (iii). The bullish pattern remains incomplete with the next decline, wave (iv) anticipated to remain soft at 5-7%.
You might also be interested in:


