


- Elliott Wave
- May 12, 2025
- 3 min read
Bitcoin Elliott Wave: Bullish Impulse Completed
Executive Summary
- Bitcoin rallied 40% over the past month.
- The rally appears to be a completed impulse pattern.
- A decline to $93,450 would be considered normal over the next few weeks.
Completed Elliott Wave Impulse Pattern
On Sunday, May 11, Bitcoin’s price appears to have completed a bullish Elliott Wave impulse pattern. There are a few scenarios to anticipate after a completed impulse. The majority of those scenarios point towards a complete retracement of the fifth wave of the impulse pattern.
For Bitcoin, this implies a decline back to $93,450.
Current Bitcoin Elliott Wave Count
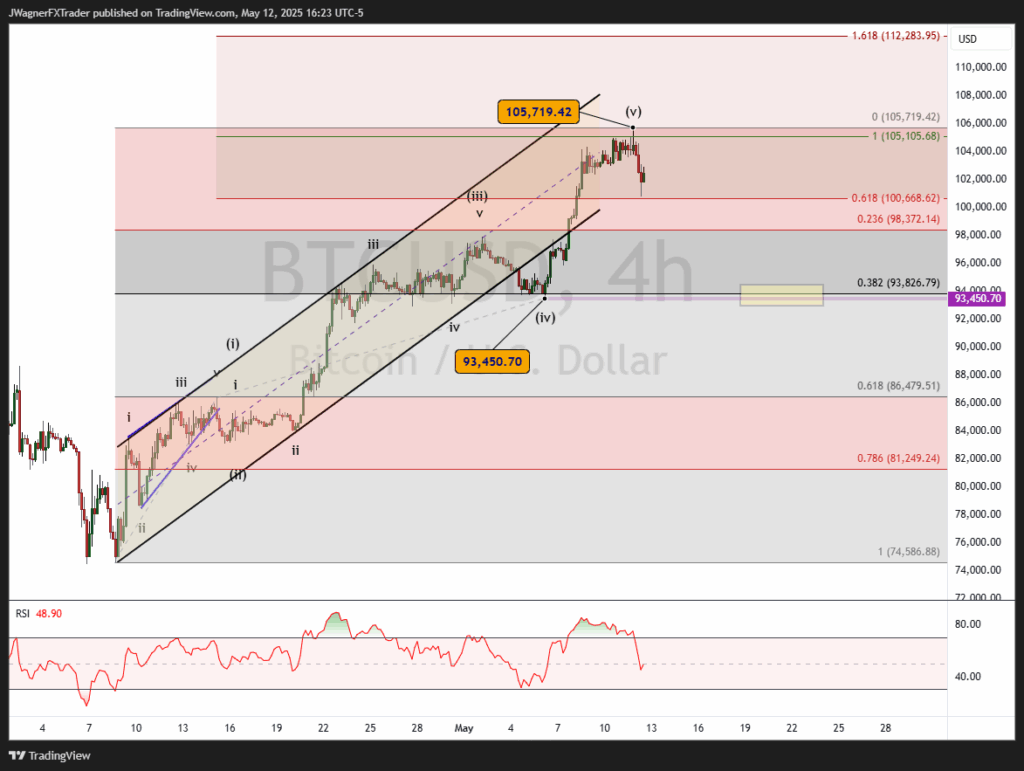
The rally that began on April 8 to May 11 appears to be a completed impulse pattern consisting of five waves.
There is fairly strong wave geometry creating the impulse pattern.
We can use our Fibonacci extension tool to measure out the length of wave (v) relative to wave (i). Wave (v) is equal to the length of wave (i) near 105k which is a common wave relationship when the third wave is extended.
It appears that wave (v) topped out at 105,719, near the target zone.
Once the impulse pattern completes, oftentimes, the entire fifth wave of the sequence is retraced. This implies a decline to the wave (iv) extreme at $93,450 is a high probability trend.
Also, when we apply the Fibonacci retracement tool to the April 8 to May 11 uptrend, the 38% Fibonacci retracement level crosses right at the wave (iv) at $93,826. This is very common geometry within a bullish impulse pattern.
Notice in the chart above how there is a support shelf of prices near the same $93k. This $93k zone will likely act like a magnet and attract prices.
This does not mean you want to short the market in anticipation of falling prices. The bullish impulse pattern suggests the larger trend is still higher. Therefore, use the falling prices as a means to reload long positions at lower levels.
Prices do not have to stop at $93k. It is possible that a decline could dig deeper to $87k and that would be considered normal after a completed impulse pattern.
A print below the 78.6% Fibonacci retracement level will be an early warning signal that another pattern is developing.
Bottom Line
Bitcoin appears to have completed a bullish impulse rally from April 8 to May 11.
A decline to $93,450 would be considered normal within a larger uptrend. The decline could dig deeper to $87k. Once the decline ends, we’re anticipating a new rally to develop to new all-time highs.
If Bitcoin drops below $81k then we’ll consider a different pattern is in development and we’ll need to reassess the wave count.
You might be interested in…


