- Elliott Wave
- Ottobre 16, 2025
- 1 min di lettura
USD/CHF Elliott Wave Forecast: Sideways Triangle
Executive Summary
- Trend Bias: USD/CHF appears to be carving a sideways triangle pattern that may lead to a bearish breakdown.
- Key Levels: Bearish below .8076.
- Target Zone: Wave ((v)) below .7829.
Current Elliott Wave Analysis
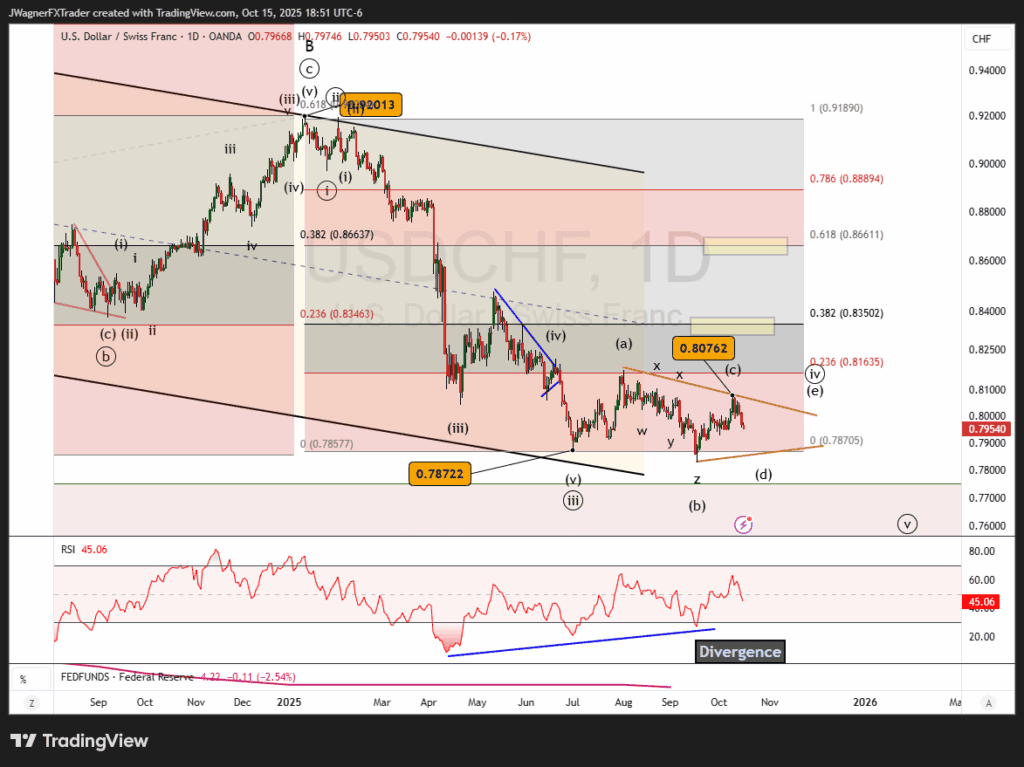
The Elliott wave analysis for the USD/CHF daily chart illustrates a sideways consolidation underway from the July low. This consolidation appears to be wave ((iv)) of a 5-wave bearish impulse pattern.
Wave ((iv)) appears to be taking on the shape of a symmetrical triangle. After another down up sequence, then the pattern may be ripe for a bearish breakdown.
This pricing within the triangle should remain below .8076 to remain valid. On a print above .8076 resistance, then we’ll consider an alternate count that a motive wave is developing from the September low.
Bottom Line
USD/CHF is likely carving a sideways triangle pattern that is bearish. After another down up sequence that holds below .8076 we are anticipating a bearish break to retest .7829.
In the unexpected rally above .8076, then we’ll consider the alternate counts.