


Scritto da:


- Chart of the Day
- Aprile 18, 2024
- 2 min di lettura
Chart of the Day: Trendline Holds For NZDUSD
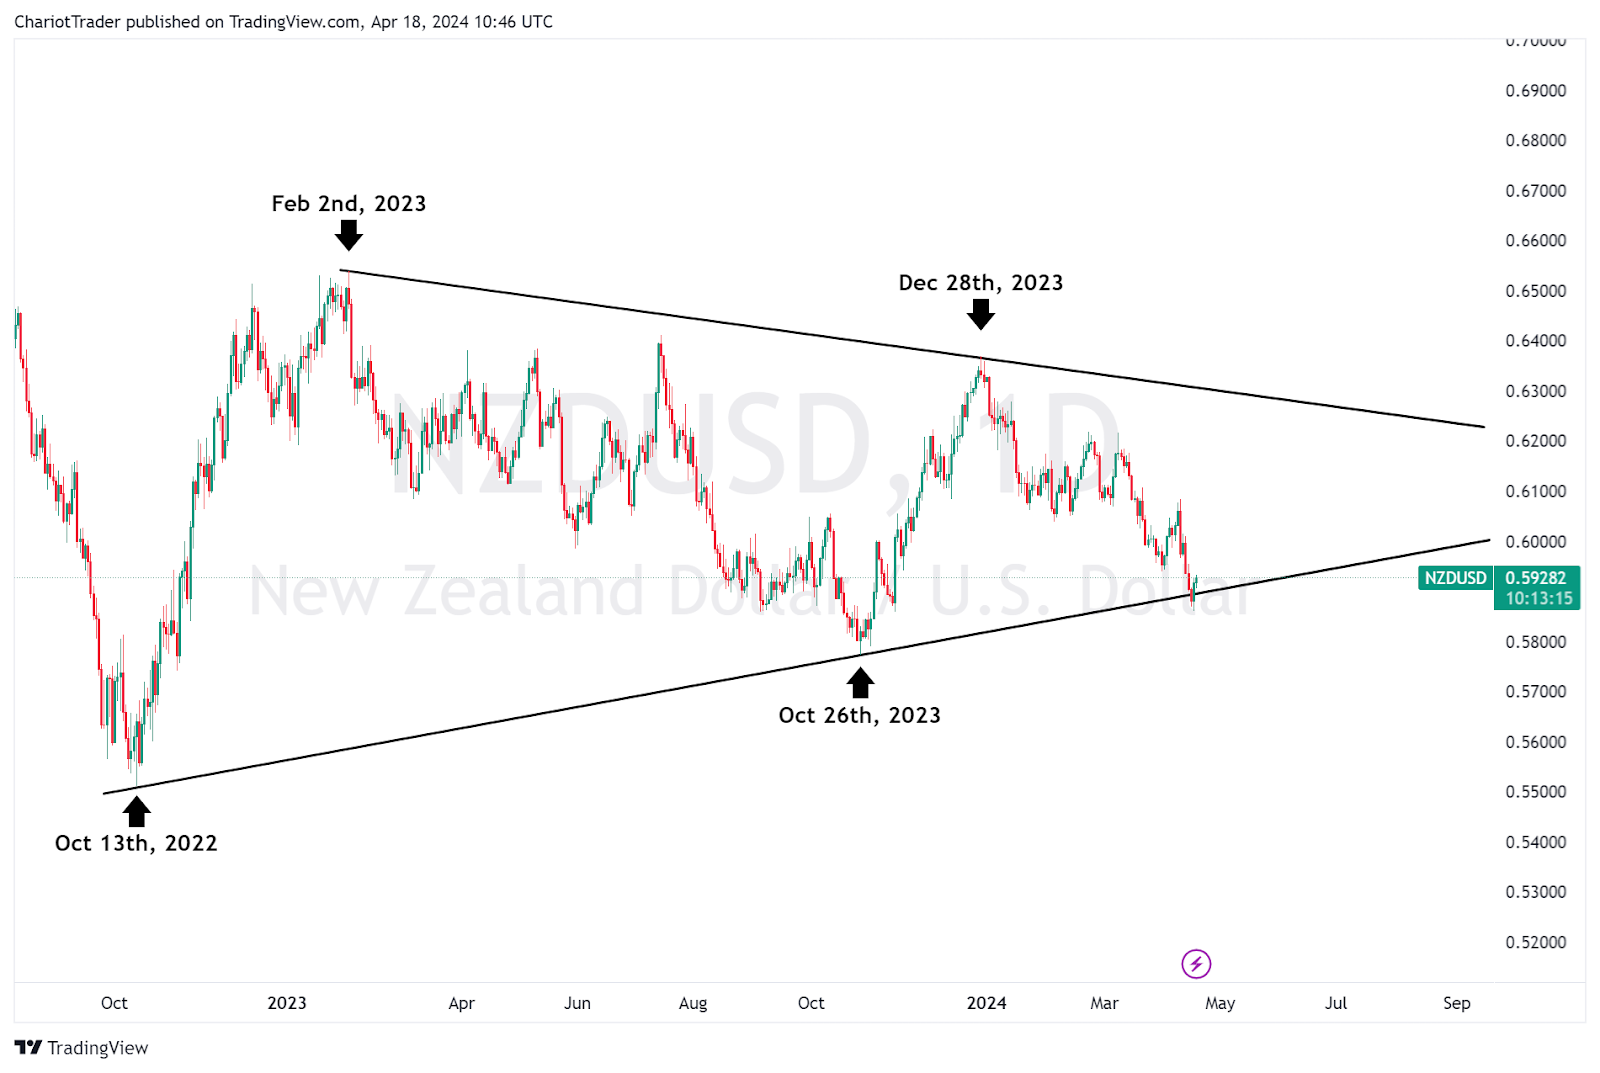
As we discussed in our previous analysis of NZDUSD, it was approaching a significant trendline spanning over 3 years. Upon initially losing the level at approximately $0.59, NZDUSD has reclaimed it the next day.
Currently, the Kiwi dollar is showing its resilience and holding above the major trendline. It’s even pushed above its previous day’s highs at $0.59254 for today.
Scenarios:
- If NZDUSD holds, it may rally to retest the pivot high around $0.606.
- If NZDUSD holds $0.606, we may continue to rally even higher to the top of the triangle.
- If NZDUSD breaks below the support trendline, we may retest the October 26 low of $0.57 or lower.
DXY Dollar Index Chart
Now, turning over to the DXY (Dollar Index Chart), we can see a divergence forming between NZDUSD and the DXY.
The DXY is technically strong, with the index forming a higher high on Monday. Depending on where the price goes, we could see a reaction at the support area of 105, or a rejection at 107.
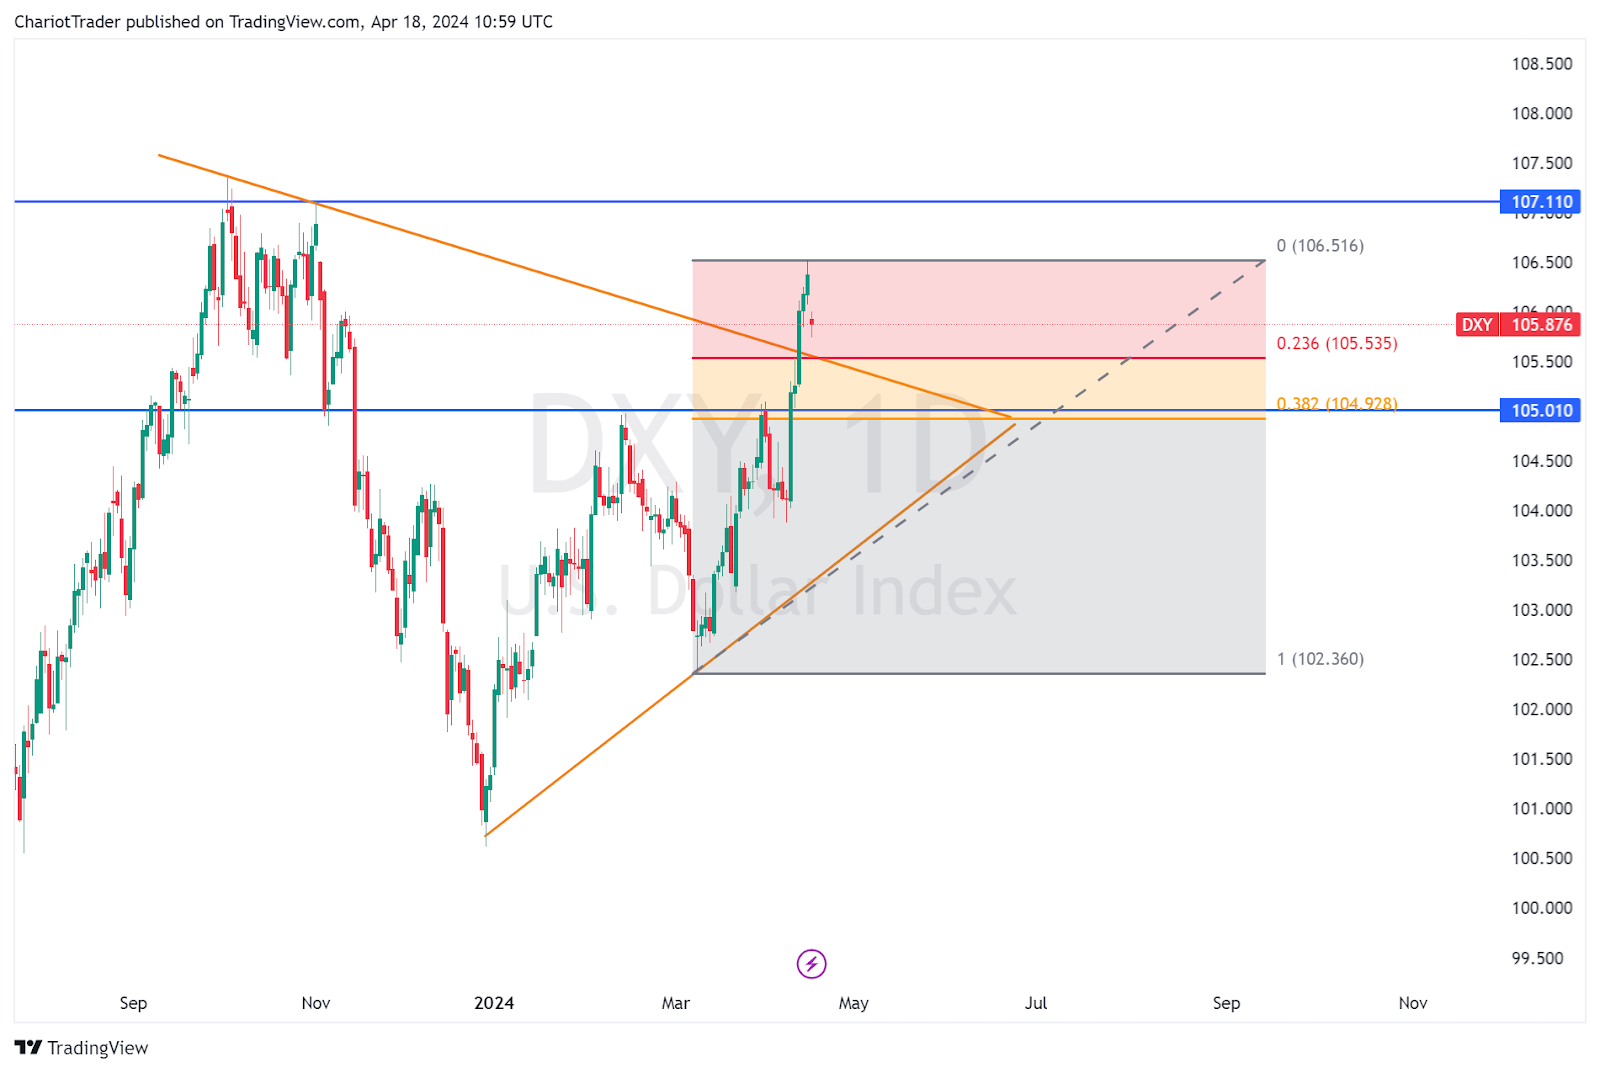
It would be interesting to watch for a posible rejection on the DXY, which would fuel NZDUSD to push higher.
Conversely, if DXY drops lower and bounces at 105, we may see NZDUSD retest $0.606 initially, only to get rejected once again.


