The RSI Divergence Explained
The Relative Strength Index indicator, or the RSI, is a momentum oscillator that tracks the speed of price changes, creating wave-like movements...
Read more
On Balance Volume (OBV) Explained With Examples
What is the On Balance Volume Indicator? The On Balance Volume (OBV) tool is a technical indicator used to gauge momentum by...
Read more
Awesome Oscillator – A Comprehensive Trader’s Guide
What is the Awesome Oscillator? The awesome oscillator (AO) is a market momentum indicator developed by Bill Williams that helps traders measure...
Read more
Williams %R (Williams Percentage Range)
What is the Williams %R Oscillator? The Williams %R is a momentum indicator used in technical analysis to measure trend strength, gauge...
Read more
Ichimoku Cloud – How to Trade It
What Is the Ichimoku Cloud? The Ichimoku Cloud indicator, also known as ichimoku kinko hyo, is a sophisticated and highly effective technical...
Read more
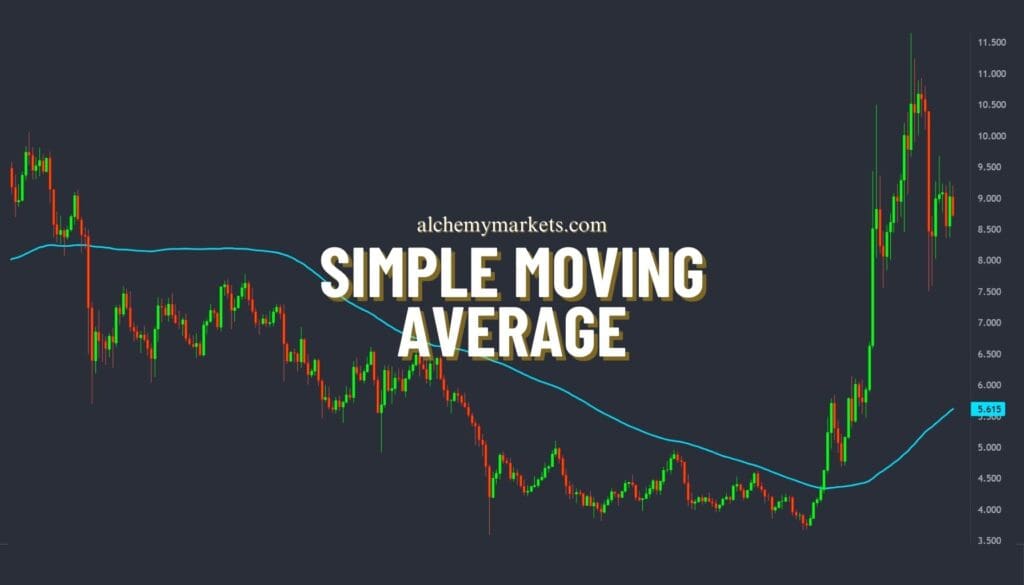
Simple Moving Average (SMA)
The simple moving average, also known as SMA, is an indicator beloved by many traders. It is an indicator used by traders...
Read more
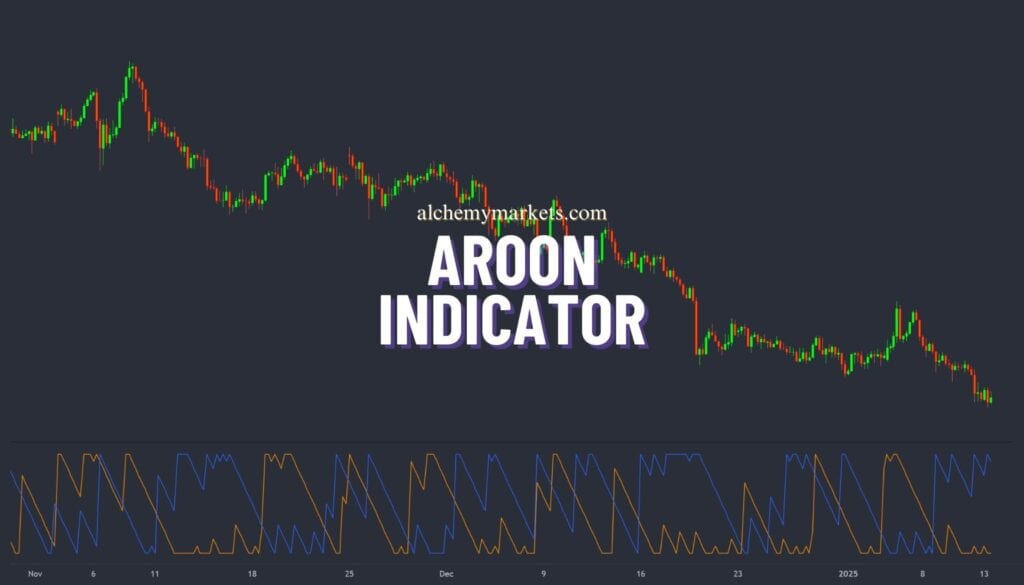
Aroon Indicator – How to Use It
What is the Aroon Oscillator? The Aroon Oscillator is a single line that plots the difference between the Aroon-Up and Aroon-Down lines....
Read more
Weighted Moving Average
The Weighted Moving Average (WMA) smooths out price data to identify price trends in the financial markets. Like all moving averages, its...
Read more
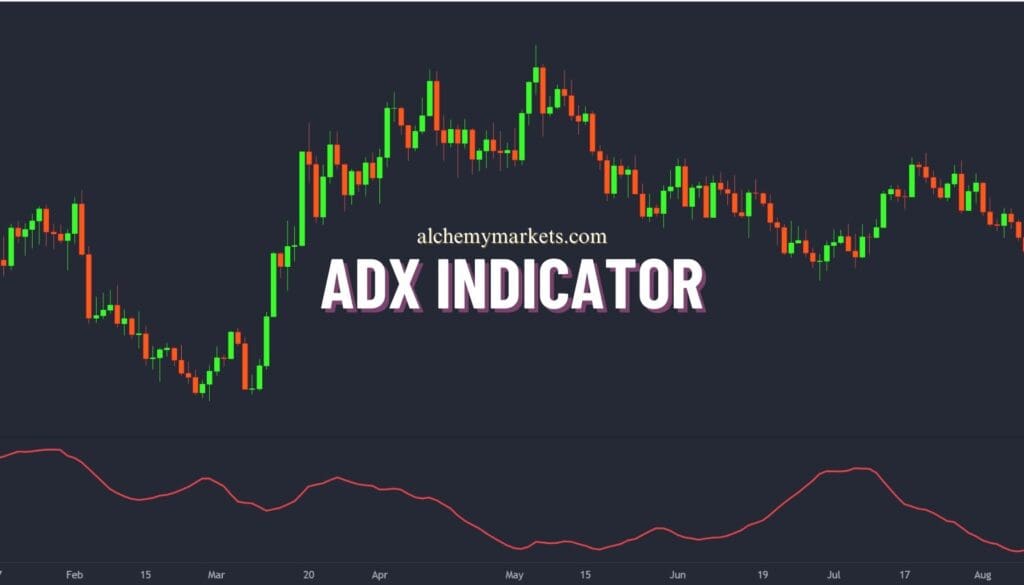
Average Directional Index (ADX)
What Is the Average Directional Moving Index (ADX)? The Average Directional Index (ADX) is a powerful technical analysis tool that helps traders...
Read more
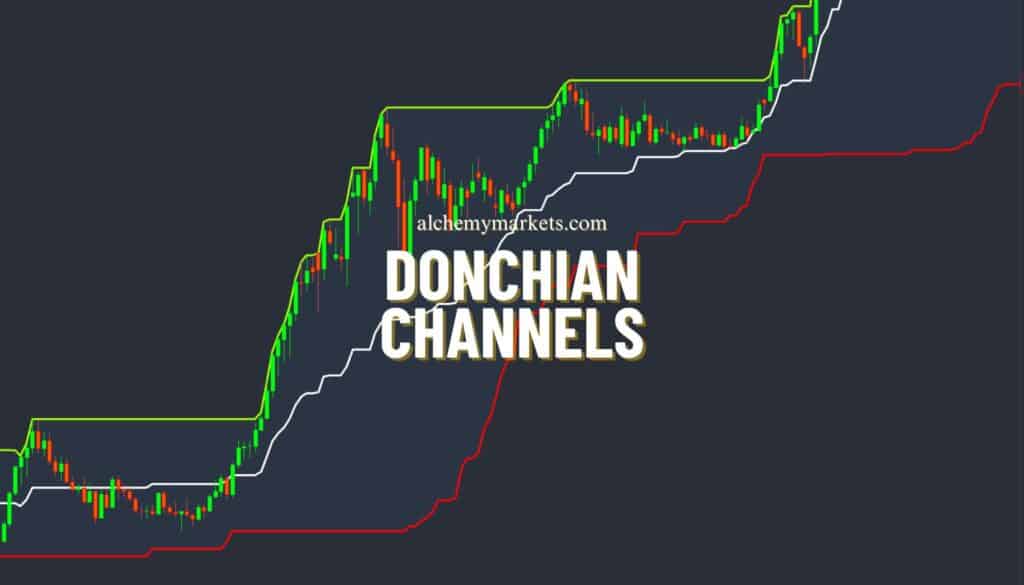
Donchian Channel Explained
What are Donchian Channels? The Donchian Channel is a technical analysis indicator used by traders to identify the absolute highs, lows, and...
Read more
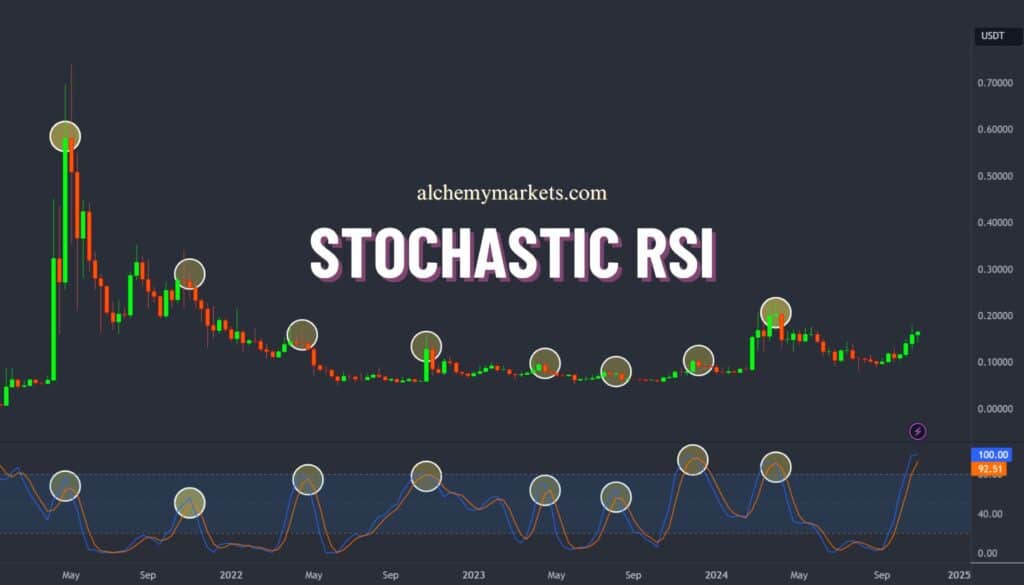
Stochastic RSI (Stoch RSI)
Stochastic RSI is a powerful tool in technical analysis that combines the concepts of the Relative Strength Index (RSI) and the Stochastic...
Read more
Keltner Channels and How to Use It
In this article, you’ll learn about the Keltner Channels and its practical use cases. Without the fluff, we’ll show you what Keltner...
Read more


