


Written by:


- Weekly Outlook
- June 14, 2024
- 10 min read
The Trinity of Central Banks: RBA, BoE, and Fed Steer the Market
Upcoming central bank decisions from the RBA, BoE, and Fed are set to impact global markets significantly. These announcements, coupled with CPI figures from the Eurozone and UK, will influence monetary policies and market reactions. Technical analysis of EUR/USD, NZD/USD, and TSLA charts reveals potential inverse head and shoulders patterns, suggesting notable market moves ahead.
Australia
RBA Interest Rate Decision
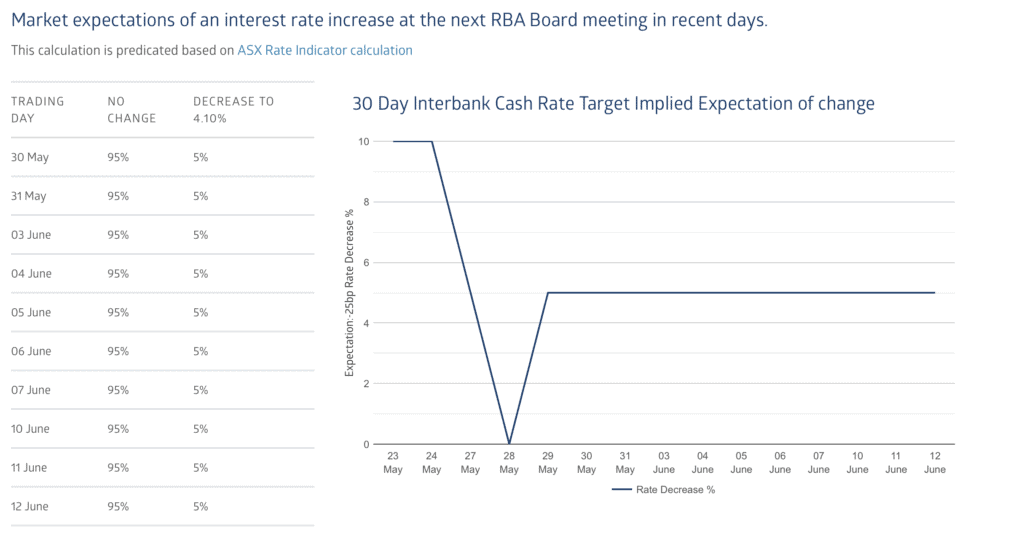
Source: ASX
Economists expect the Reserve Bank of Australia (RBA) to keep its cash rate at 4.35% during its meeting on June 18, 2024. This follows a series of aggressive hikes from a record low of 0.10%, starting in May 2022. These rate increases aimed to control persistent inflation driven by high housing, fuel, and energy costs. Despite some signs of easing, inflation remains above the target range of 2-3%. Economists believe the RBA will adopt a cautious stance. They await more consistent evidence of declining inflation before considering any rate cuts.
Market reactions will likely be subdued if the RBA holds the rate steady as this outcome is already priced in. Hints of future rate cuts could lead to a depreciation of the Australian dollar (AUD). Signals of continued tightening might strengthen it. The RBA’s forward guidance will be crucial in shaping market expectations. Investors should closely watch the central bank’s accompanying statements for any indications of policy changes.
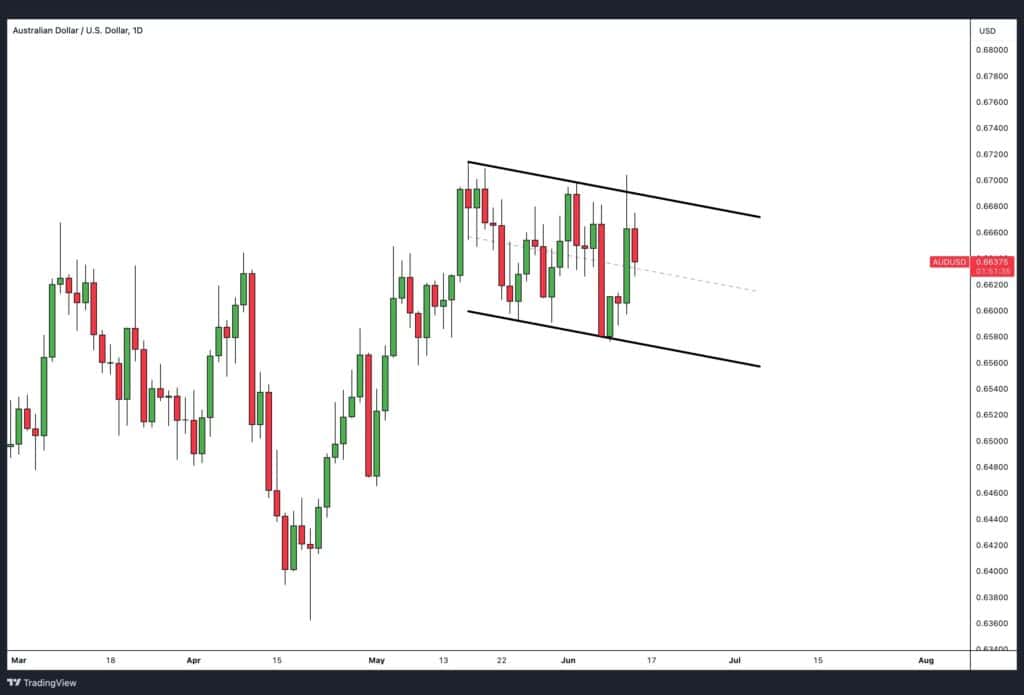
AUD/USD: Technical Analysis
The AUD/USD chart illustrates a downward-sloping channel reflecting a recent period of consolidation within the broader trend. If the RBA maintains its current interest rate as expected, the immediate reaction in the AUD might be minimal. This scenario is already factored into the market.
Any dovish signals from the RBA, such as hints at potential rate cuts later in the year, could weaken the AUD further within this channel. It might potentially test lower support levels. It might potentially test lower support levels. Traders should monitor the RBA’s statements closely for insights into future monetary policy directions.
Euro Zone
CPI
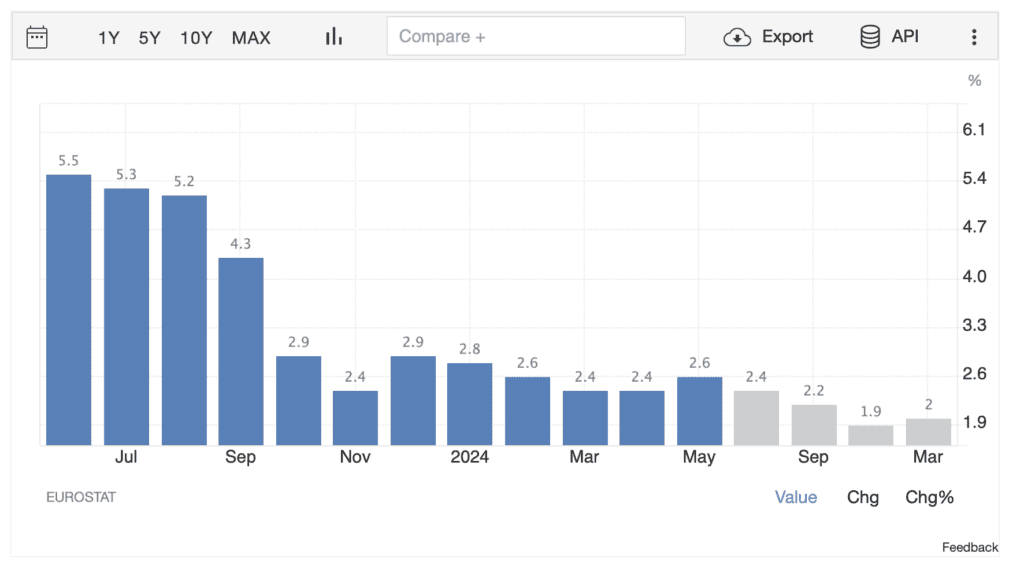
Source: Trading Economics
Eurozone inflation has been moderating but still exceeds the European Central Bank’s (ECB) target of 2%. Analysts forecast the Consumer Price Index (CPI) for May 2024 to rise to 2.6% year-over-year, up from 2.4% in April 2024. This increase is largely driven by services inflation, which has climbed to 4.1%. A slight uptick in energy prices after months of decline also contributes.
Analysts expect the CPI to be 2.6% for May 2024, slightly above the ECB’s target. This indicates a steady rise in prices. This modest increase reflects ongoing price pressures in services and modest gains in energy prices. Economists closely watch the ECB’s response as persistent inflation in services and the broader economic context could influence future monetary policy. If the CPI data aligns with forecasts, the immediate reaction in the euro may be muted. This figure is largely anticipated by the market. A higher-than-expected CPI could result in the euro appreciating due to increased expectations of future ECB rate hikes. A lower-than-expected CPI could weaken the euro, signaling a prolonged period before any monetary tightening.
The Eurozone CPI release on June 18, 2024, is a critical indicator for assessing the region’s inflation trajectory and the ECB’s potential policy responses. Inflation is slightly above target but shows signs of stabilisation. The market will closely watch for any signals from the ECB regarding future monetary policy adjustments.
EUR/USD: Technical Analysis
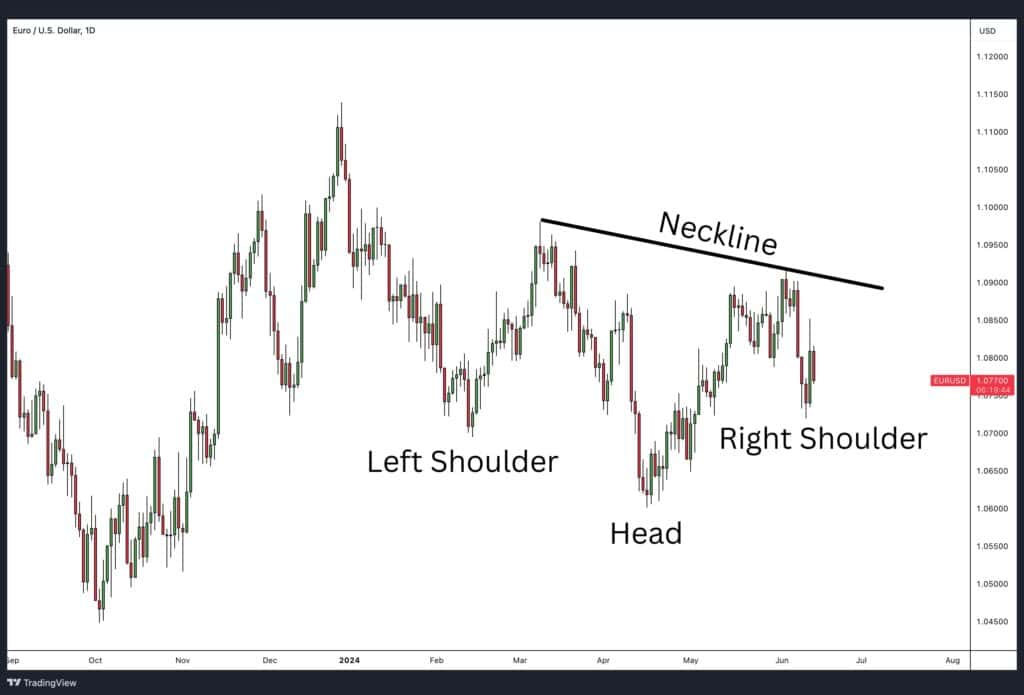
The EUR/USD chart displays a classic inverse head and shoulders pattern, which is often indicative of a bullish reversal. Despite the deflationary trends currently observed, there are predictions of forward inflationary pressures. The left shoulder formed in late 2023. The head formed in early 2024, and the right shoulder is developing as we approach mid-2024. The neckline, drawn through the highs of the shoulders, is a critical resistance level. Given the potential inflationary pressures, there is a strong likelihood that the market could break through this neckline.
A successful breakout above the neckline would confirm the reversal pattern. This suggests a shift from the bearish trend to a bullish outlook for the euro. Traders should watch for a decisive close above the neckline to validate this potential uptrend.
United Kingdom
CPI
Source: Office for National Statistics
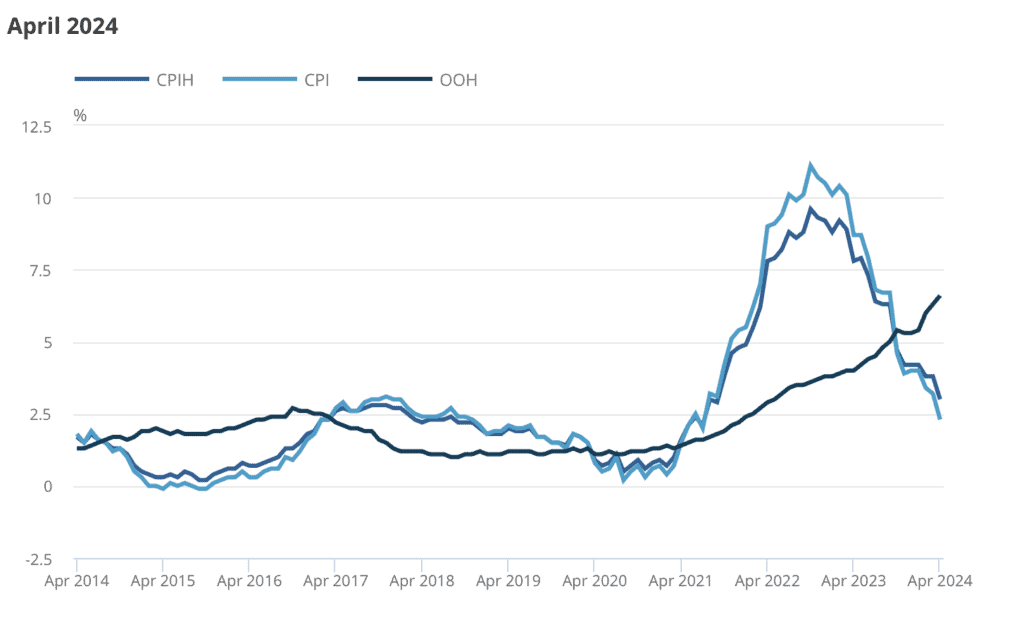
The United Kingdom has experienced a significant reduction in its inflation rate over the past year. The Consumer Price Index (CPI) for April 2024 showed an annual inflation rate of 2.3%. This is down sharply from 3.2% in the previous month and well below the recent peak of 11.1% in October 2022. This decline is mainly due to lower energy prices following the reduction of the Ofgem energy price cap. Reduced price pressures across various sectors, including housing, household services, food, and beverages, also contributed.
Analysts forecast the CPI for May 2024 to remain at 2.3% year-over-year. This suggests that the downward trend in inflation is holding steady. However, the rate is still above the Bank of England’s (BoE) target of 2%.
The upcoming UK CPI release on June 19, 2024, will be a critical indicator for assessing the inflation trajectory and the BoE’s potential policy moves. Inflation is currently showing signs of stabilisation. The market will closely watch the data for any deviations that could influence the BoE’s monetary policy stance and consequently the GBP’s valuation.
If the CPI data meets the forecast, the reaction in the British pound (GBP) is likely to be neutral. A higher-than-expected CPI could strengthen the GBP and break through the resistance zone due to increased expectations of continued tight monetary policy. A lower-than-expected CPI could weaken the GBP, signaling potential earlier rate cuts by the BoE.
Bank of England Base Rate Decision
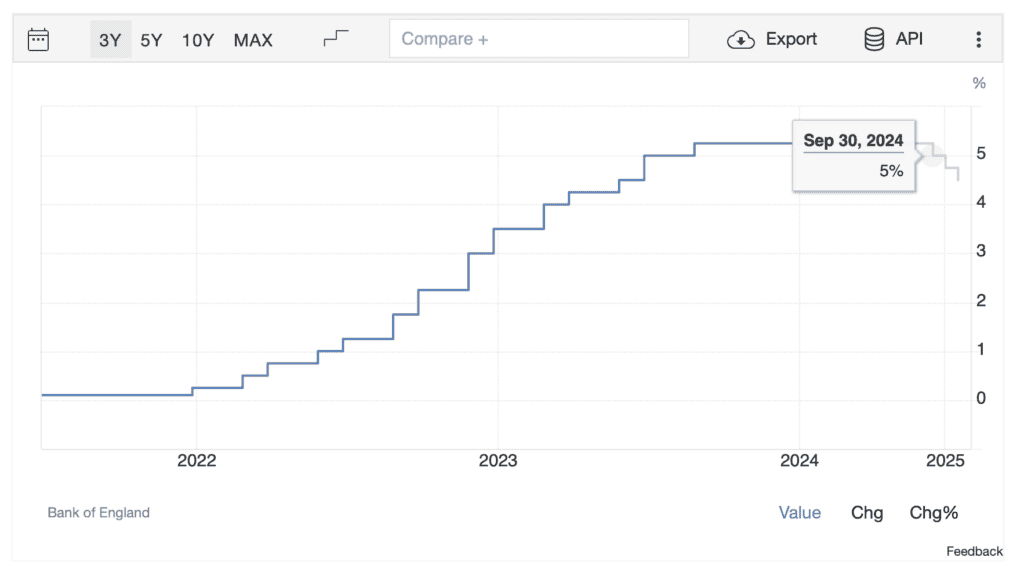
Source: Trading Economics
The Bank of England (BoE) has kept its interest rate at 5.25% since the last hike in November 2023, marking a 16-year high. This is part of its efforts to combat persistent inflation. Despite recent declines, inflation remains above the target level, with the Consumer Price Index (CPI) dropping to 2.3% in April 2024 from a high of 11.1% in October 2022. Inflation trends and key economic indicators such as employment and wage growth heavily influence the BoE’s policy decisions
For the upcoming meeting on June 20, 2024, the market consensus is that the BoE will maintain the interest rate at 5.25%. However, there are growing speculations about potential rate cuts later in the year, possibly starting in August depending on upcoming economic data. Economists are divided, with UBS anticipating the first rate cut in August due to persistent inflation pressures. The BoE’s Monetary Policy Committee remains cautious, with some members leaning towards rate cuts amidst signs of easing inflation. Ongoing concerns about wage growth and service price inflation persist.
The BoE’s decision on June 20, 2024, is crucial for setting the tone for future monetary policy. While the current expectation is for the rate to remain unchanged, markets will closely scrutinise any forward guidance or hints towards future rate cuts. Investors and analysts will pay particular attention to the BoE’s statements on inflation trends and the economic outlook to gauge the likelihood and timing of any policy changes.
GBP/USD: Technical Analysis
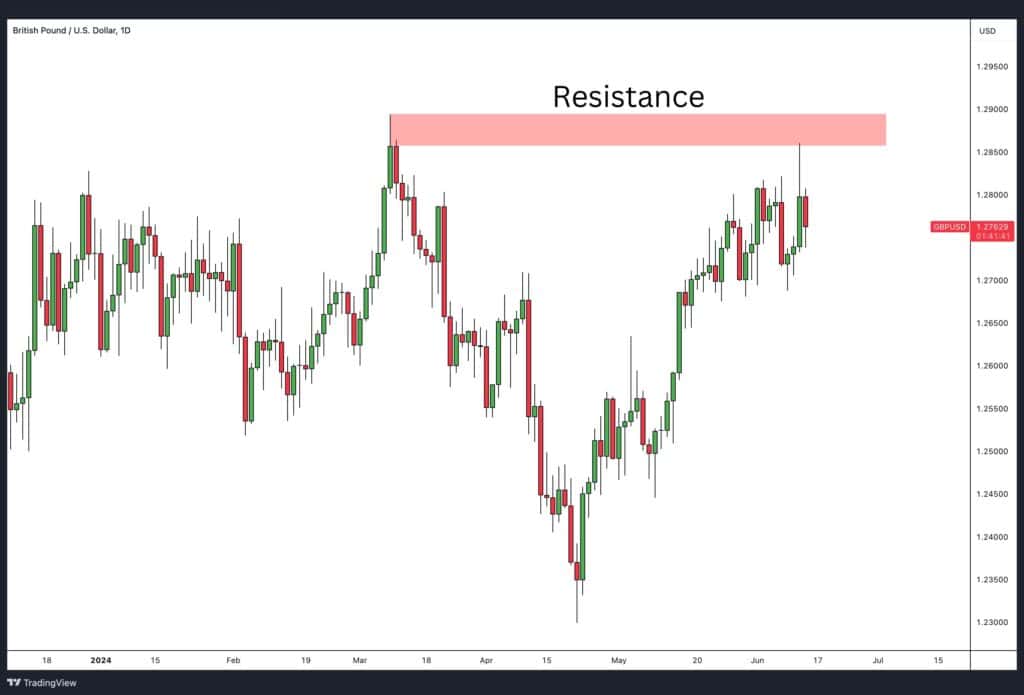
If the BoE holds the interest rate steady as expected, the immediate reaction in the British pound (GBP) will likely be neutral. This outcome is already priced into the market. Any indications of future rate cuts could lead to a depreciation of the GBP. Lower interest rates typically make a currency less attractive to investors. Conversely, if the BoE hints at a prolonged period of high rates, the GBP could strengthen due to expectations of higher returns on UK assets.
United States
Fed Monetary Policy Report
Source: The Family Office
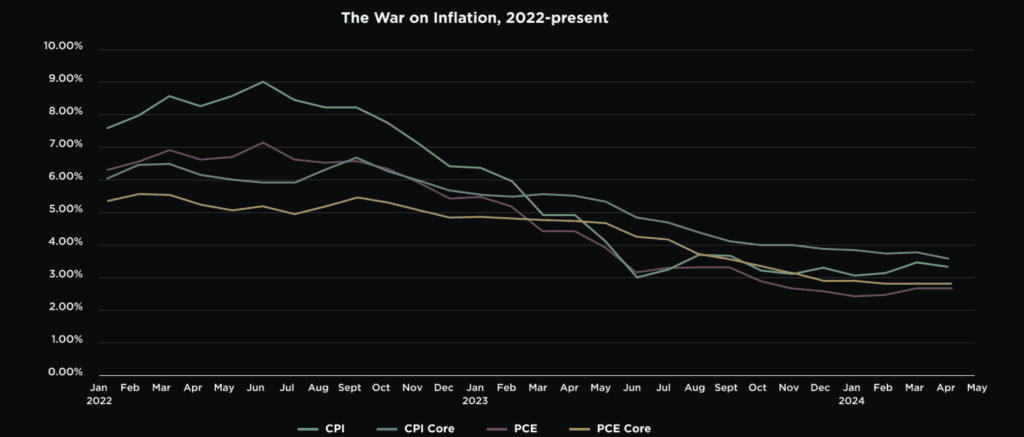
The Federal Reserve’s Monetary Policy Report, set for release on June 21, 2024, will provide a detailed overview of current economic conditions, monetary policy decisions, and the outlook. The Fed has kept the federal funds rate at a range of 5.25% to 5.50% since July 2023, aiming to combat persistent inflation which remains above the 2% target. Recent data suggests inflation has stalled around 3%, and the Fed has signaled that further rate cuts are unlikely until there is more consistent evidence of inflation moving sustainably towards their goal.
The market expects the Fed to maintain its current rate stance with significant attention on the details provided in the Monetary Policy Report. The Fed has been gradually reducing its balance sheet through quantitative tightening and plans to slow this reduction starting in June 2024. This cautious optimism reflects the Fed’s belief that while inflation is stabilising, it is not yet sufficiently controlled to warrant rate cuts.
The release of the Monetary Policy Report will likely influence the US dollar (USD) in several ways:
• Hawkish Tone: If the report emphasizes ongoing inflation risks and the need for maintaining a high interest rate environment, the USD could strengthen as higher interest rates attract foreign investment seeking better returns.
• Dovish Signals: Conversely, if the report hints at potential rate cuts later in the year or acknowledges significant progress in controlling inflation, the USD might weaken. This is because lower interest rates reduce the attractiveness of USD-denominated assets.
• Quantitative Tightening Adjustments: Any adjustments to the pace of quantitative tightening could also impact the USD. A slower reduction in the Fed’s balance sheet might ease financial conditions slightly, which could be interpreted as a dovish move, potentially weakening the USD.
Overall, the market will closely monitor the Fed’s language and forward guidance to gauge the future path of monetary policy. Investors should be prepared for potential volatility in the USD depending on the nuances of the Fed’s assessment and projections.
Dollar Index: Technical Analysis
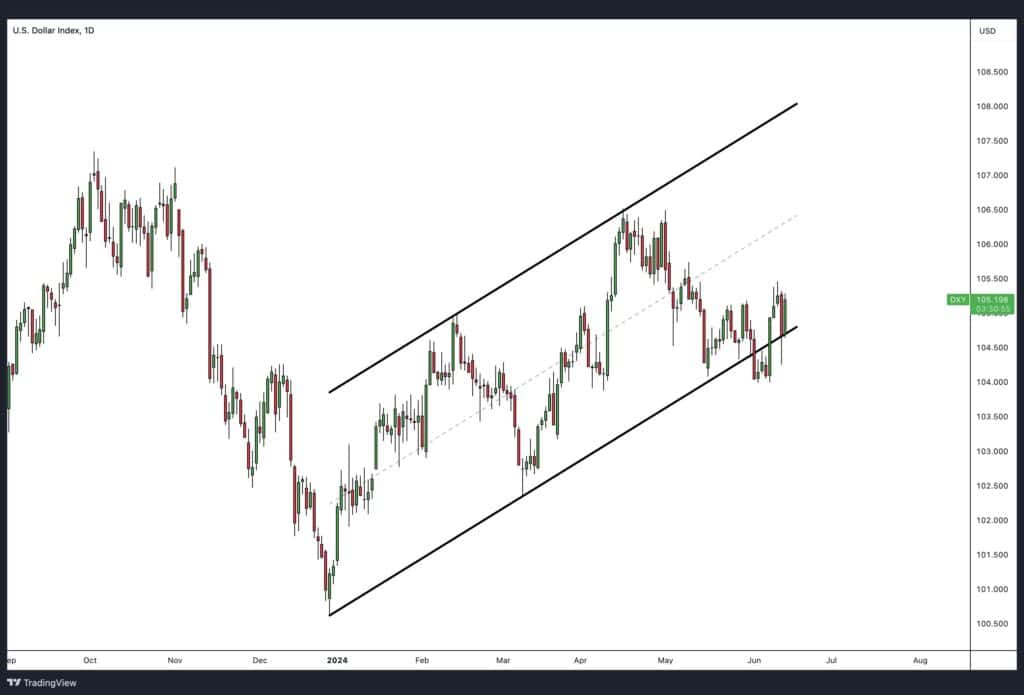
If the Federal Reserve signals a very hawkish stance, we can anticipate that the price will stay within the ascending channel. Conversely, a dovish tone from the Fed could potentially cause the price to break below the lower bound of the descending channel.
Technical Analysis
NZD/USD: Inverse Head and Shoulders Pattern
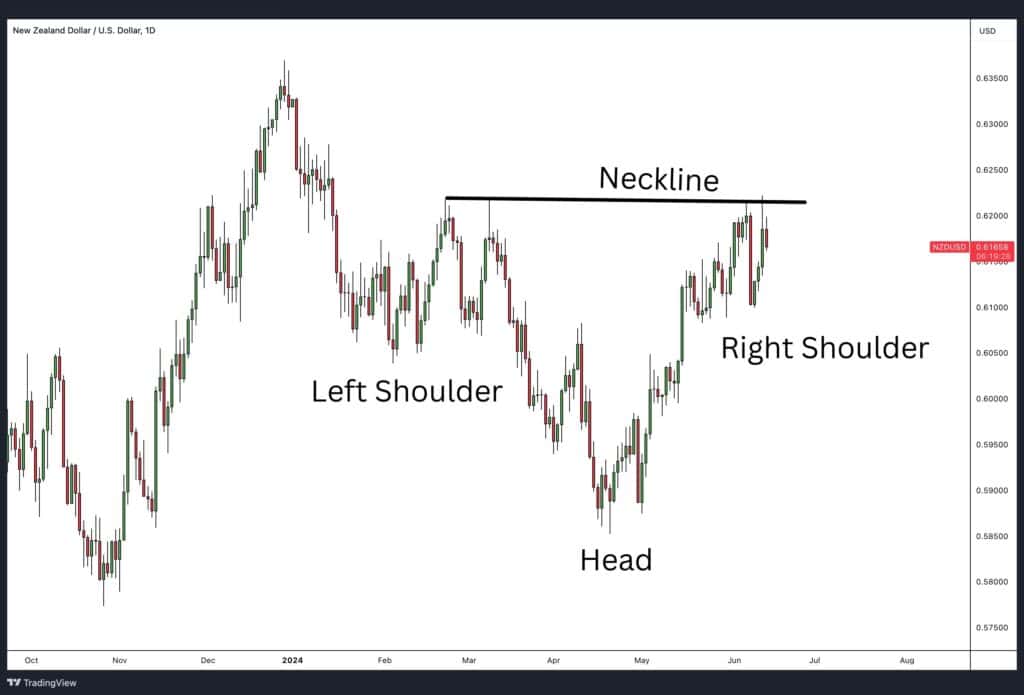
Source: TradingView
The NZD/USD chart reveals a well-defined inverse head and shoulders pattern, suggesting a potential bullish reversal.
The left shoulder formed in February 2024, the head in April 2024, and the right shoulder is currently forming. The neckline, which is nearly horizontal, marks a significant resistance level. Considering the overall bullish setup, there is a high probability of the market breaking through this neckline.
A confirmed breakout would indicate a shift from the bearish trend to a bullish outlook for the New Zealand dollar. Traders should monitor this level closely for confirmation of the reversal.
TSLA: Inverse Head and Shoulders Pattern
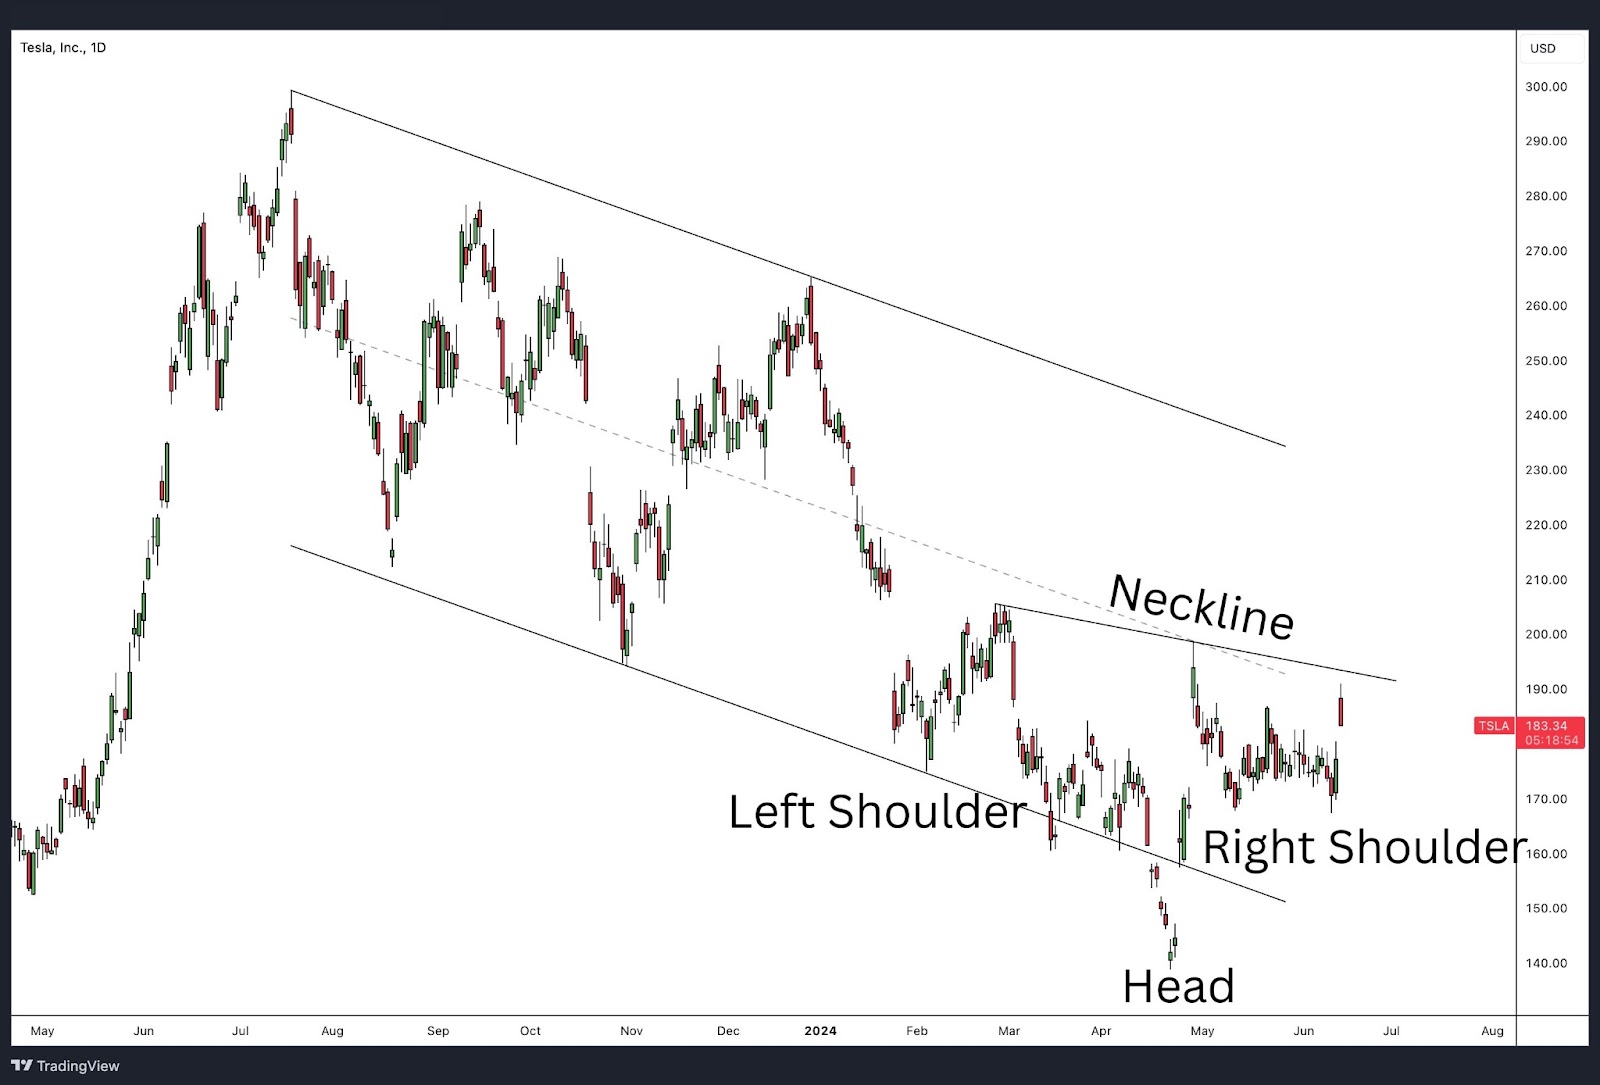
Source: TradingView
TSLA is climbing due to positive developments surrounding Elon Musk’s compensation package. During the annual shareholder meeting, significant support emerged for Musk’s $55.8 billion pay package, which a Delaware judge had previously voided. This approval signals positivity by investors, alleviating concerns about Tesla’s leadership and future direction.
Additionally, Tesla has announced potential price hikes in Europe due to new tariffs on electric vehicles imported from China, which could boost revenue in that region.
The TSLA chart also shows an inverse head and shoulders pattern forming within a descending channel. The left shoulder formed in late 2023, the head in April 2024, and the right shoulder is currently developing. The neckline, which is sloping downward, serves as a key resistance level. Given the recent positive news, there is potential for the stock to break above the neckline, signaling a reversal from the current downtrend to a bullish trend.


