


Written by:

- Weekly Outlook
- July 5, 2025
- 6 min read
Are Tariffs Still a Threat to the Global Economy? A Deeper Look into Today’s Trade Landscape
As global trade tensions tense up again, the question arises: do tariffs still carry the same economic weight? With threats of duties ranging from 10% to 70% on numerous trading partners—and Vietnam already facing doubled tariffs—the spotlight is squarely back on the effectiveness and consequences of protectionist trade policy.
Market Response: Fading Fears or Familiar Ritual?
Recent spikes in tariff rhetoric seem to attract less shock than they used to. Markets have grown accustomed to last-minute threats ahead of negotiation deadlines. As a result, some volatility (for instance in FX risk premiums) has surfaced—but the expectation remains that upcoming tariff renegotiation deadlines will likely pass without major incident.
The average U.S. tariff rate, currently hovering around 14%, appears to be seen more as a ceiling than the start of a new round. The general consensus? Another gradual escalation is unlikely unless talks completely stall.
Tariff Revenue, Stockpiles, and the Illusion of Stability
From a fiscal lens, the short-term situation looks deceptively positive:
- Equity markets are at or near record highs.
- Consumer prices have yet to rise significantly.
- Government coffers continue benefiting from tariff revenues.
At the same time, many companies have front-loaded imports and filled warehouses under the assumption of future tariffs—giving them a window to absorb cost increases without passing them on to consumers, for now.
Inflation: A Delayed Reckoning
Don’t be lulled by calm consumer-price data—it could be deceptive. History shows it takes months for tariff-induced cost shocks to fully appear in inflation reports.
Now that inventory buffers are running low, a significant price impact seems imminent. Analysts expect inflation to pick up noticeably over the next few months—potentially reshaping expectations around monetary policy and pushing back anticipated rate cuts.
Growth Pressures and Fiscal Constraints
Tariff policy hasn’t just affected prices—it’s also subtly slowed growth. While headline indicators (like employment) may still look solid, indicators such as business sentiment and investment show growing caution.
Meanwhile, rising fiscal deficits—bolstered by recent government spending—risk raising financing costs. While bond markets have remained calm for now, any surge in inflation or heavy summer debt issuance could quickly unsettle investors.
Europe’s Dilemma: Currency Dynamics & Trade Tensions
Europe faces a double bind. A rising euro makes exports pricier and complicates the ECB’s efforts to maintain its inflation target. Any unexpected U.S. tariffs on EU goods would further reduce inflationary pressure, possibly prompting additional monetary easing.
With ECB commentary hinting at discomfort over currency strength, the euro’s trajectory has become more relevant to both trade and monetary strategy.
Looking Ahead: Key Events to Watch Next Week
Here are the critical economic and policy events next week that may shift perspectives around tariffs, inflation, and central bank strategy:
| Date | Event | Why It Matters |
|---|---|---|
| Monday–Wednesday | FOMC Meeting Minutes | Insights into how open the Fed is to delaying easing due to rising cost pressures. |
| Tues–Thurs | U.S. Export-Import & Inventory Reports | Hard data on whether companies still have stockpiles or begin passing on costs. |
| Wednesday | Durable Goods Orders | Signals on business investment and manufacturers’ pricing outlook. |
| Thursday | Eurozone Retail Sales + Sentiment Surveys | Helps assess the eurozone economy’s resilience under uncertainty. |
| Friday | U.S. Core PCE Deflator (June) | Official inflation gauge—potential early sign of upward tariff-driven pressures. |
| Ongoing | Market Reaction to Currency Moves | Fluctuations in EUR/USD and USD dynamics will test central bank communications. |
Tariffs may have lost some of their headline punch, but their economic effects remain growing under the surface. As inventory buffers deplete and inflation begins to heat up, both central banks and traders will recalibrate, potentially shifting the outlook on rate policy and growth.
Watch next week’s data closely—especially manufacturing, inventory, and inflation releases—they could be the trigger points that set the tone for the next phase of global economic policy.
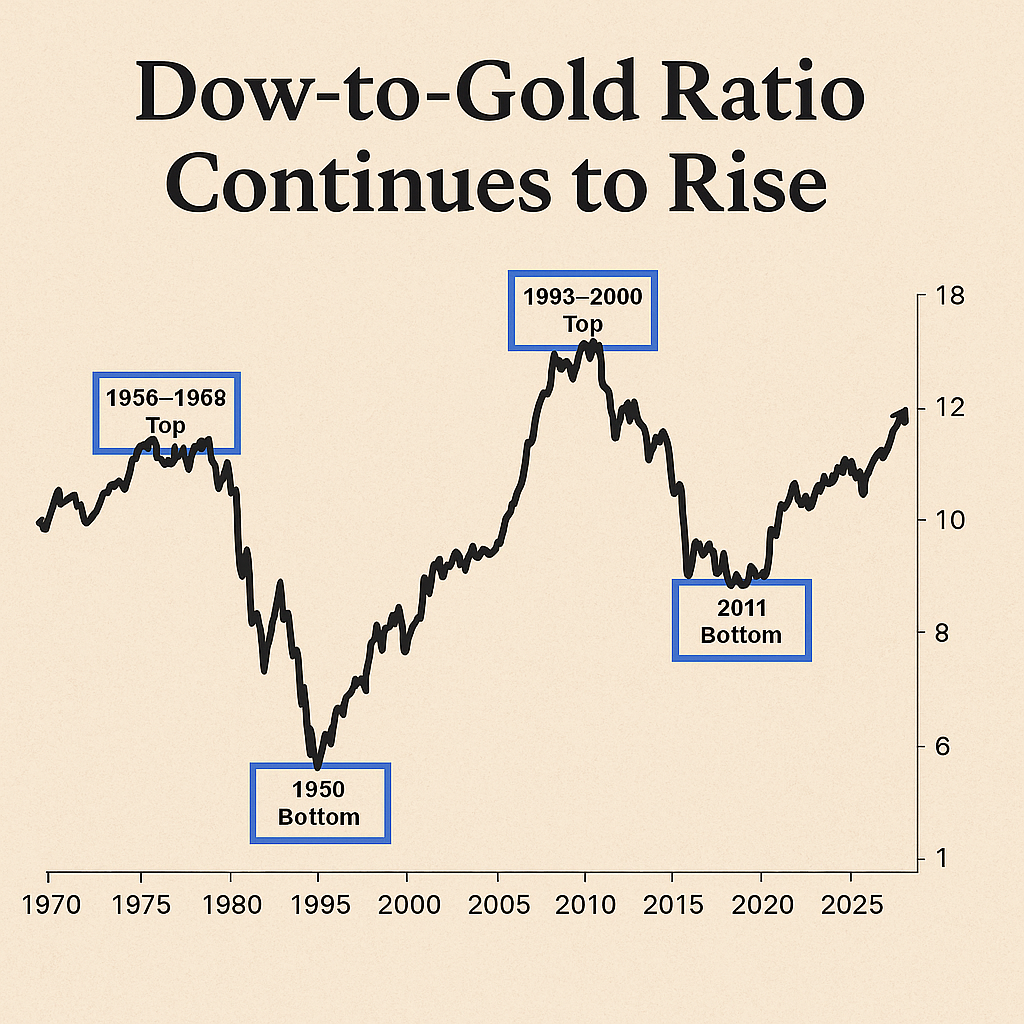
Technical Analysis: Dow/Gold Ratio – Historical Reversal Zones
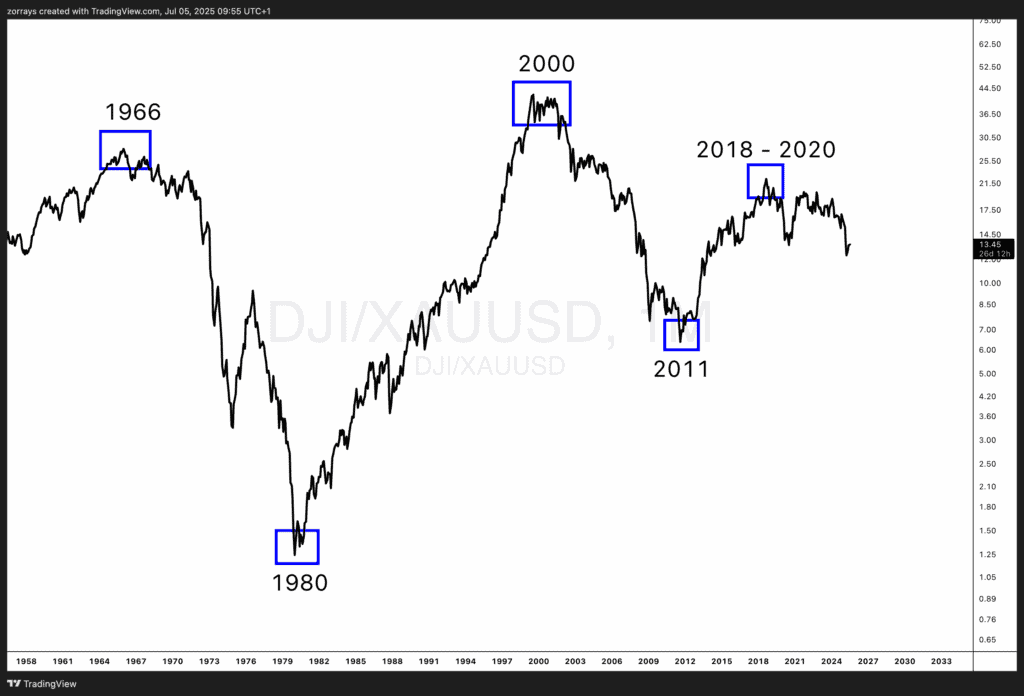
The Dow/Gold (DJI/XAUUSD) ratio chart reveals critical cyclical turning points where equities relative to gold either peaked or bottomed, often around major macroeconomic inflection points. Let’s break down the boxed areas:
1966–1968 Top
- Context: U.S. inflation pressures begin rising; Vietnam War spending increases.
- Trigger: The Federal Reserve tightens policy into late 1960s, leading to a prolonged equity bear market and rising gold prices post-Bretton Woods stress.
1980 Bottom
- Context: Stagflation peaks; inflation hits double digits.
- Trigger: Gold skyrockets as Fed Chair Volcker begins aggressive interest rate hikes. Equities fall sharply, ending in one of the lowest equity-to-gold ratios in history.
1999–2000 Top
- Context: Dot-com bubble reaches peak valuation.
- Trigger: Tech-driven equity euphoria peaks, while gold is at long-term lows. Bursting of the bubble and 2001 recession shifts capital into hard assets.
2011 Bottom
- Context: Post-GFC gold mania amid QE and sovereign debt fears.
- Trigger: Gold peaks near $1,900 as markets fear inflation and currency debasement. Meanwhile, U.S. equities begin a secular bull run from early 2009 lows, narrowing the ratio.
2018–2020 Top
- Context: Equities reach stretched valuations; Fed policy tightens into 2018.
- Trigger: Trade war tensions, pandemic uncertainty, and aggressive monetary easing cause gold to surge and equities to briefly falter, marking another local peak in the ratio.
These turning points underline how the Dow/Gold ratio is highly sensitive to monetary policy, inflation expectations, and macro confidence cycles. Each reversal often marks a broader capital rotation—from risk assets to safety, or vice versa.
Base Case Outlook: Ratio Set to Climb Further
The Dow-to-Gold ratio continues to be a powerful macro signal for assessing long-term shifts in investor preference between equities and hard assets. Historical turning points—highlighted on the chart—have consistently coincided with major economic regime changes, from stagflation and monetary tightening to tech bubbles and systemic crises. These inflection zones show how capital moves in cycles between risk-on and risk-off assets depending on inflation trends, policy shifts, and macroeconomic sentiment.
Looking ahead, the base case suggests the ratio is poised to climb further. With equity markets regaining strength, gold losing short-term momentum, and the U.S. economy showing surprising resilience, conditions increasingly favor stocks over gold. While geopolitical and debt-related risks remain, the recent easing of trade tensions and fading inflation concerns are encouraging capital to rotate back into growth assets—setting the stage for a continued rise in the Dow-to-Gold ratio.


