


- Quarterly Forecast
- Weekly Outlook
- June 30, 2025
- 5 min read
Q3 2025 Forecast: USD Looks For Relief From Oversold Conditions
We are now at the halfway point of 2025 and some of the forecasts have played out as anticipated while other forecasts were missed.
In this Q3 forecast, we use Elliott Wave Theory as a basis for analysing these markets. We’ll analyse the current patterns and determine where the current price is within those patterns, and discuss anticipated trends.
US Dollar
Fed target interest rates haven’t moved, but DXY sure has. Market participants have been anticipating rate cuts to grow, especially when the Tariff Tantrum appeared in April.
Now, the street is still anticipating 50-75 basis points of cuts within the next 6 months. Typically, when a central bank lowers rates, capital leaves that currency to seek yield elsewhere.
However, the H1 2025 decline is one of the largest to start a year and this decline is mature and ready to bounce.
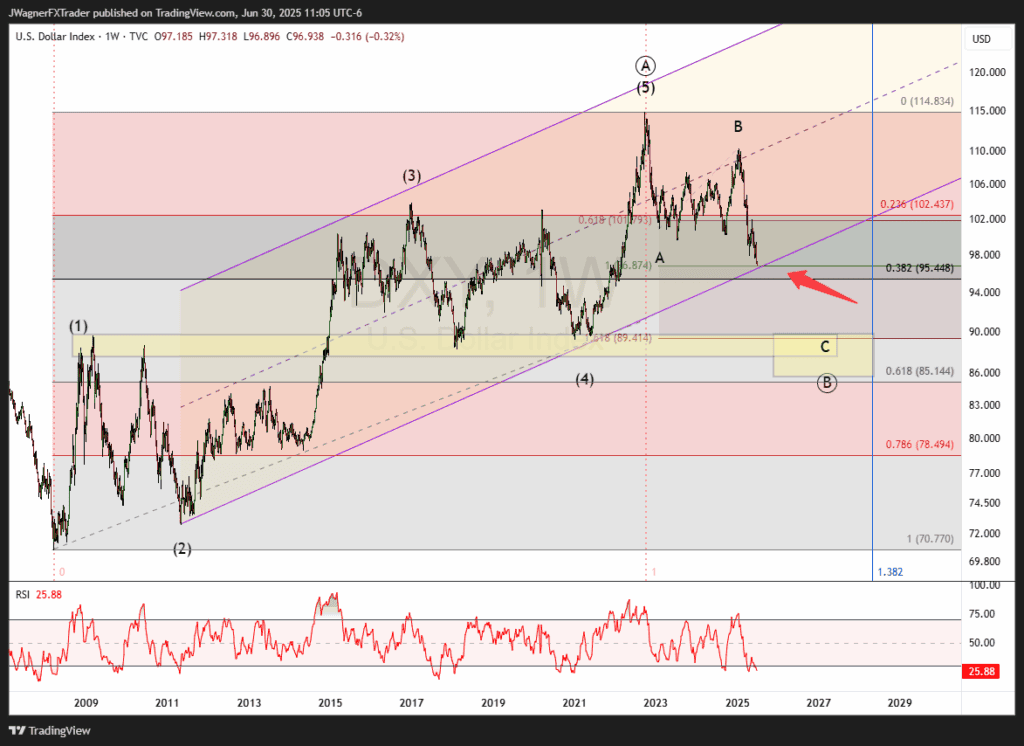
This is a weekly chart going back to 2008. There is a 5-wave rally and DXY is now going through a 3-wave decline. The 3-wave decline started in 2022 with waves A & B already complete. The decline from January 2025 is part of wave C.
Notice, the 38% Fibonacci retracement level from the 2008-2022 rally is near the current pricing of 98.
Additionally, take note of an upward sloping parallel price channel in place from the 2011 low. The support trend line passes through near 96.5 (ish).
There is an equal wave relationship where wave C would equal wave A near 96.32.
These 3 levels create a potential reversal zone between 96-98. That may sound like a large range to you, but this includes price levels going back to 2008!
Sometime in July, look for DXY to find a bottom and reverse higher. Upside targets for DXY include 102 and possibly 105. I am anticipating this rally in DXY to last the duration of Q3 and possibly bleed into Q4.
If DXY keeps slicing lower, the next major level of support is near 88.
EURUSD
Our Q2 forecast for EURUSD called for a cyclical rally that “carries to 1.18 and possibly higher in the coming quarters.”
EURUSD ended the quarter at the 1.17 handle, just below the first target.
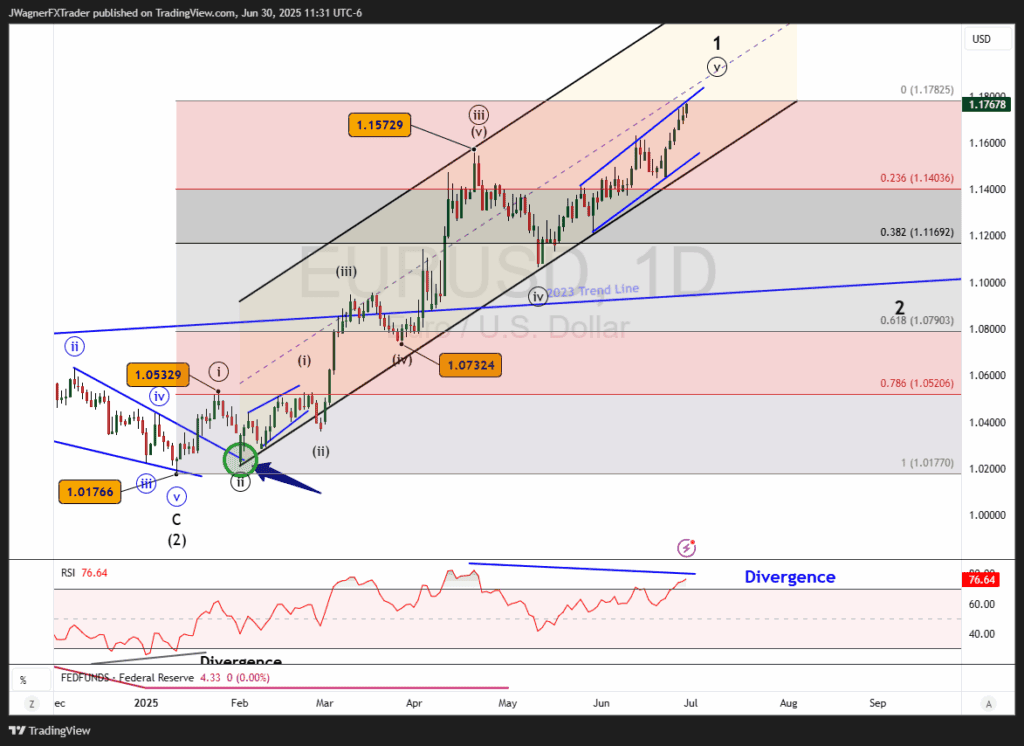
Similar to DXY, there is an equal wave measurement near 1.18 that EURUSD is on top of right now. The current pricing is where the H1 2025 rally is the 100% Fibonacci Extension of the Q4 2022 rally. Over the long term, I don’t think this will be a major top, but these longer-term Fib levels generally offer some hesitations and shorter-term reversals.
We can count out a five-wave rally from January so the risk of a bearish reversal is increased. Once the bearish reversal is underway, it would likely hail as the largest decline in EURUSD since the January 13, 2025 bottom.
This decline could carry back to 1.11 – 1.12 and represent wave ‘2’ of a larger 5-wave advance. This means this wave ‘2’ decline would set the table for a wave ‘3’ rally.
GBPUSD
Our Q2 forecast called for dip then a rally up to 1.32-1.33. The dip came, pushing Cable down to 1.27. Turns out we were a little light on the size of the rally as Cable jumped up to finish the quarter in the 1.37 handle.
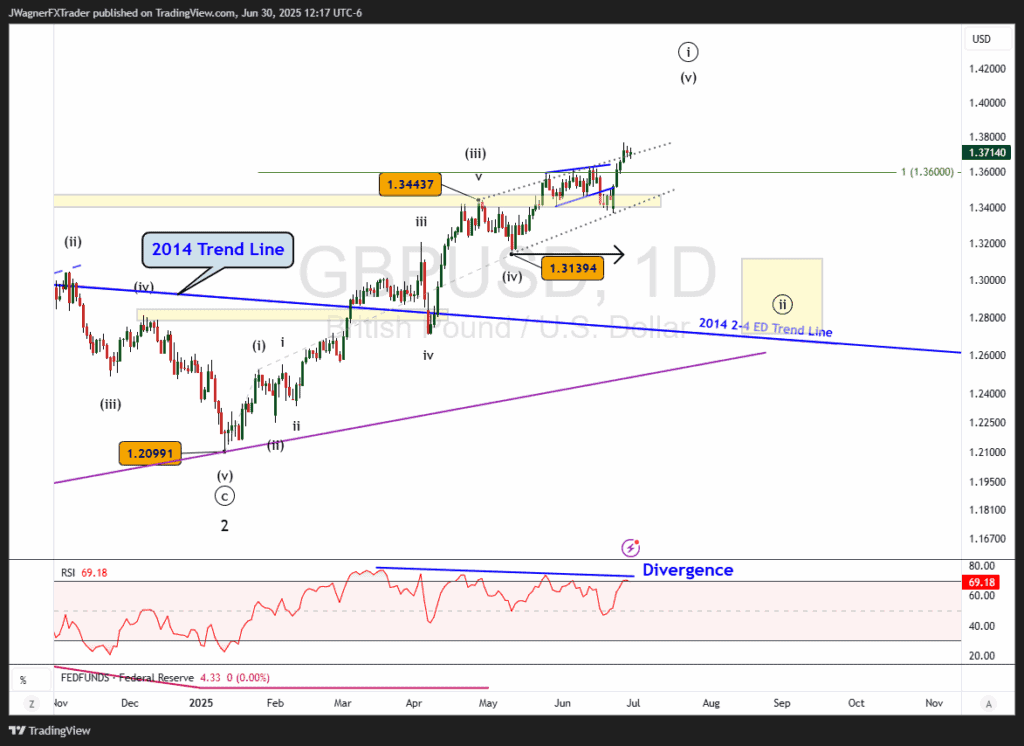
Looking ahead, there is heavy RSI divergence on the daily chart going back to March…essentially lasting all of Q2. This divergence provides a warning that even though upward momentum has been strong, it is waning.
The Elliott wave count is advanced and appears to be in the terminal fifth wave of the 5-wave impulse. There may be a little more upside to go, perhaps around 1.40, but we are on alert for a bearish reversal to carry back to 1.31-1.34.
Look for the bears to take over in Q3 and bring valuations back down to lower levels, perhaps reaching 1.31 – 1.34.
USDJPY
The Q2 included a couple of different models we were following. One of the models forecasted a decline to 140 and possibly lower levels.
Well, USDJPY did decline to 140 in April. However, it did not break below the support shelf that was created going back to 2024.
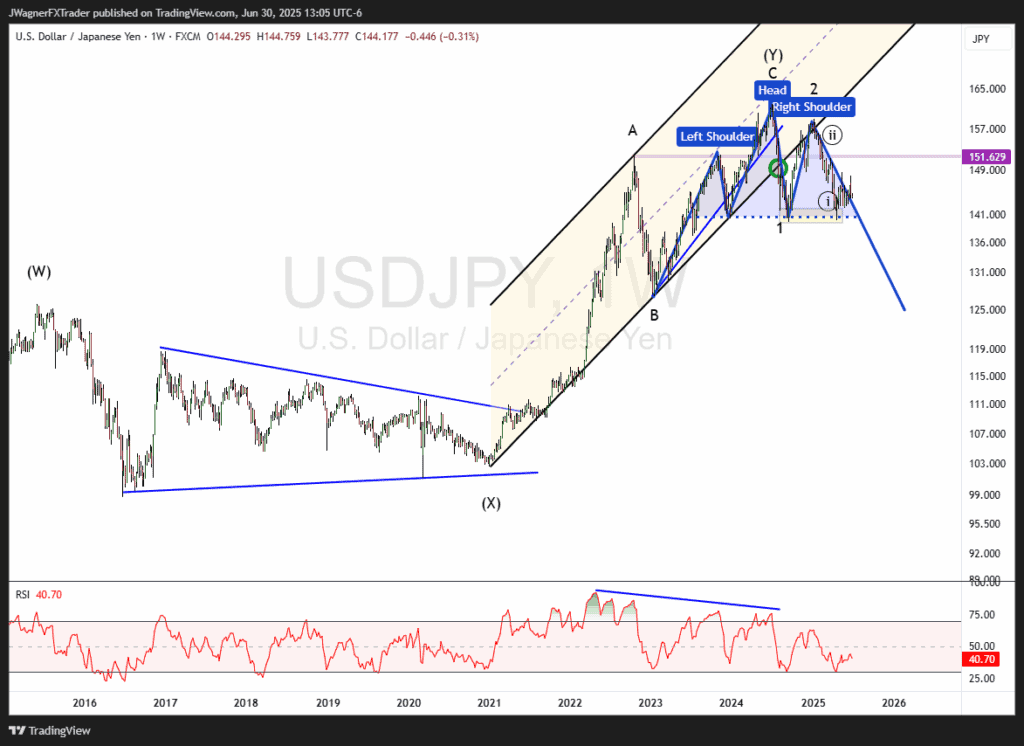
It is possible that a large head and shoulders pattern is visible on the weekly chart above. A break of the neckline at 139 would confirm the pattern and lead to a deepening downtrend. The Head and Shoulders target would sit near 125.
From an Elliott wave perspective, a breakdown below 139 would represent wave 3 of 3 at multiple degrees of trend and target much lower levels near 125.
At this time, I am uncertain as to the prospects of a breakdown below 139. Perhaps new activity by the Fed or BoJ that sparks interest rate changes (or expectations) could be the catalyst to drive USDJPY below 139.
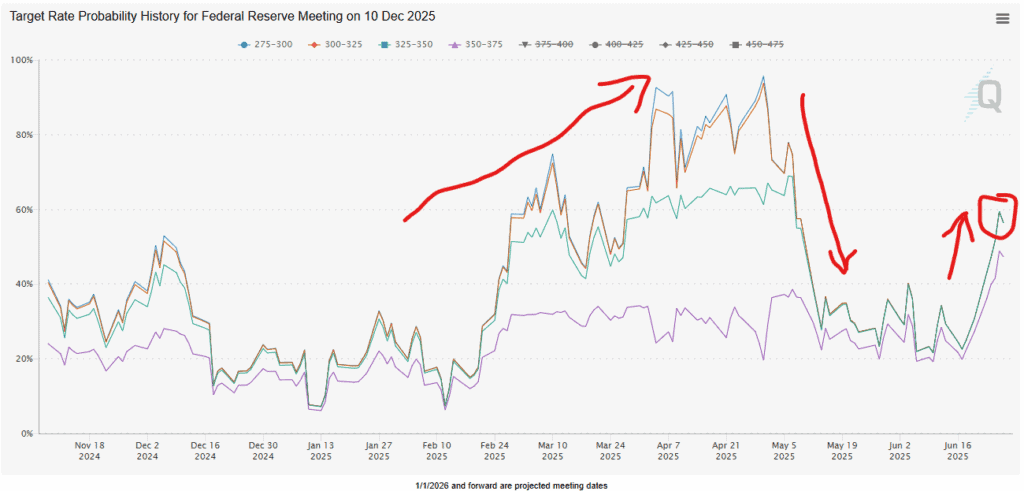
Source: Fedwatch
As it stands right now, the street is anticipating 3 rate cuts for the rest of 2025. The expectations for rate cuts have oscillated back and forth. During the Tariff Tantrum, 3 or more rate cuts were appearing to be a sure thing. Then, as May wore on, those expectations declined. Only recently, in June, have the 3 or more rate cut expectations increased again.
If the Fed cuts rates, that would weigh on USDJPY.
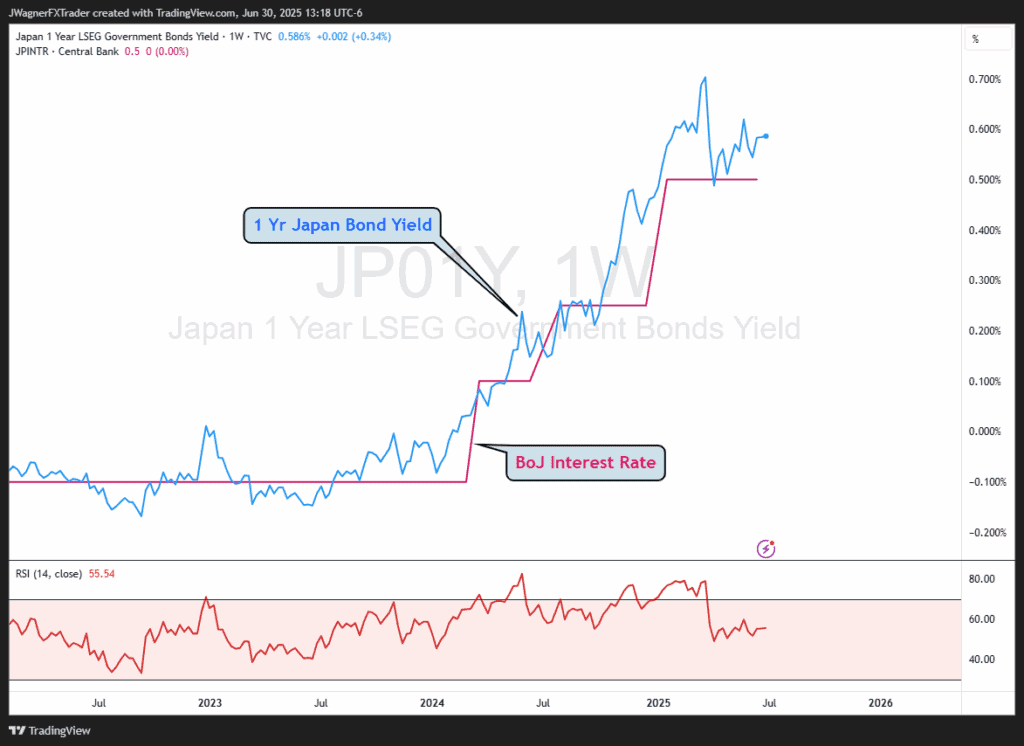
Meanwhile, the 1 year Japanese Bond Yield has been leading the target interest rate set by the Bank of Japan. Currently, the 1 year yield is near 0.6% with a brief rally up to 0.7%.
If BoJ decides to raise rates then that could send USDJPY drastically lower as the carry unwind may appear.
USDCAD
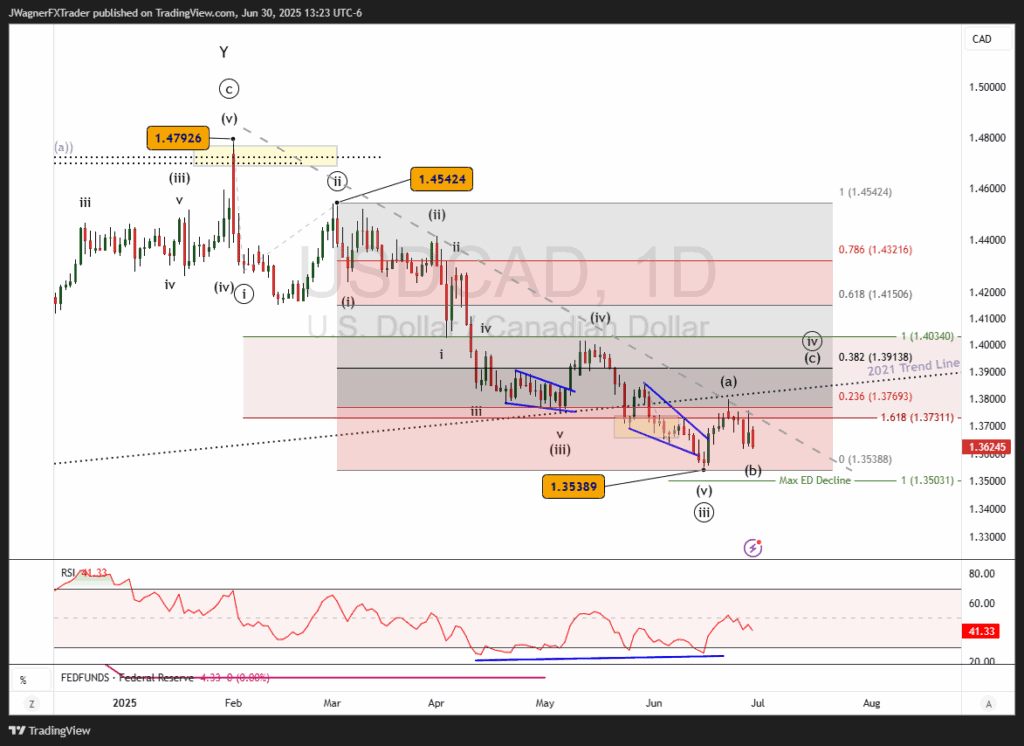
USDCAD has reached a temporary bottom and the oversold conditions may need relief. Our Elliott wave count is that wave ((iii)) terminated in June and a wave ((iv)) rally is underway.
The underside of the 2021 broken trend line (black dotted line) is holding prices down for now. Wave relationships for a terminal point in wave ((iv)) appear near 1.38-1.40.
Once wave ((iv)) is in place, the model calls for another decline below 1.35 in wave ((v)).
Other Q3 2025 Forecasts:


