


Written by:


- Opening Bell
- July 16, 2024
- 3 min read
Triangles Everywhere in The Market With Dovish Fed Speech
Fed Chair Jerome Powell gave a speech yesterday at the Economic Club of Washington, presenting a dovish tone to investors. He said the latest data somewhat ‘adds confidence’ that inflation is on track to the Federal Reserve’s 2% target. With this in mind, investors are anticipating a cut before the 2% inflation target is reached.
This dovish statement comes at a time where many assets are forming a symmetrical triangle pattern on the daily, weekly, and even monthly time frames, presenting some exciting trading opportunities.
WTI (USOIL) Monthly Triangle
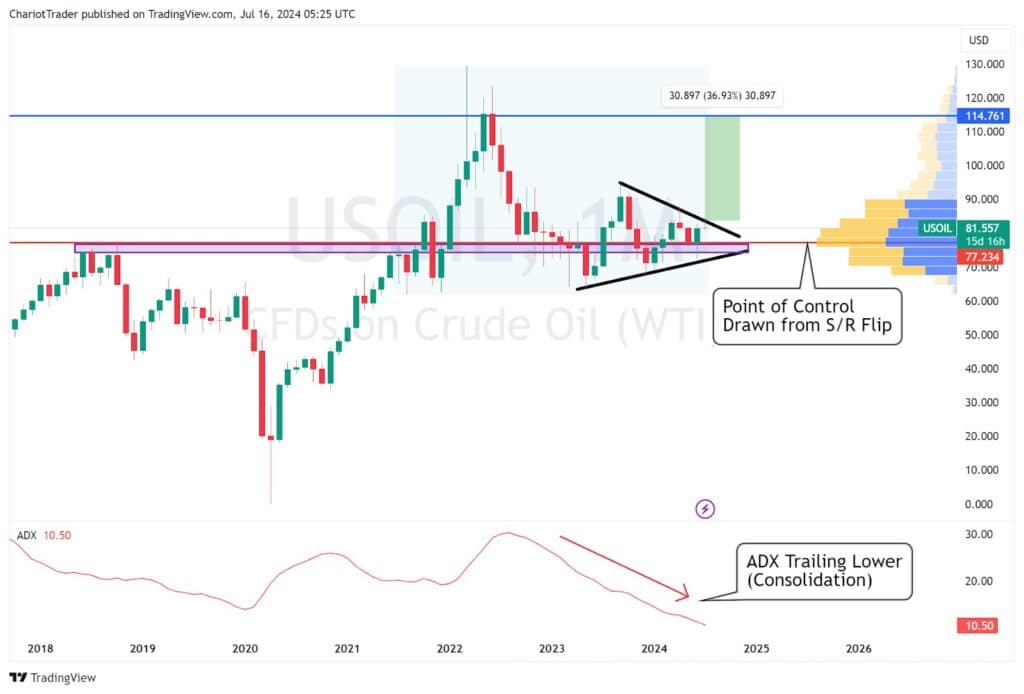
Since May 2023, Crude Oil (USOIL) has been forming a monthly symmetrical triangle pattern. We can use the ADX momentum indicator to confirm this, as it shows a steady decline while the price zig-zags, indicating a period of consolidation.
Currently, USOIL sits above the Point of Control (the area with the highest trading volume) from July 2023 at $77.234, making it a significant support level. Assuming a bullish bias, the breakout target for this triangle pattern is approximately $114.761, which aligns with the highest close in 2022.
EURUSD Weekly Triangle
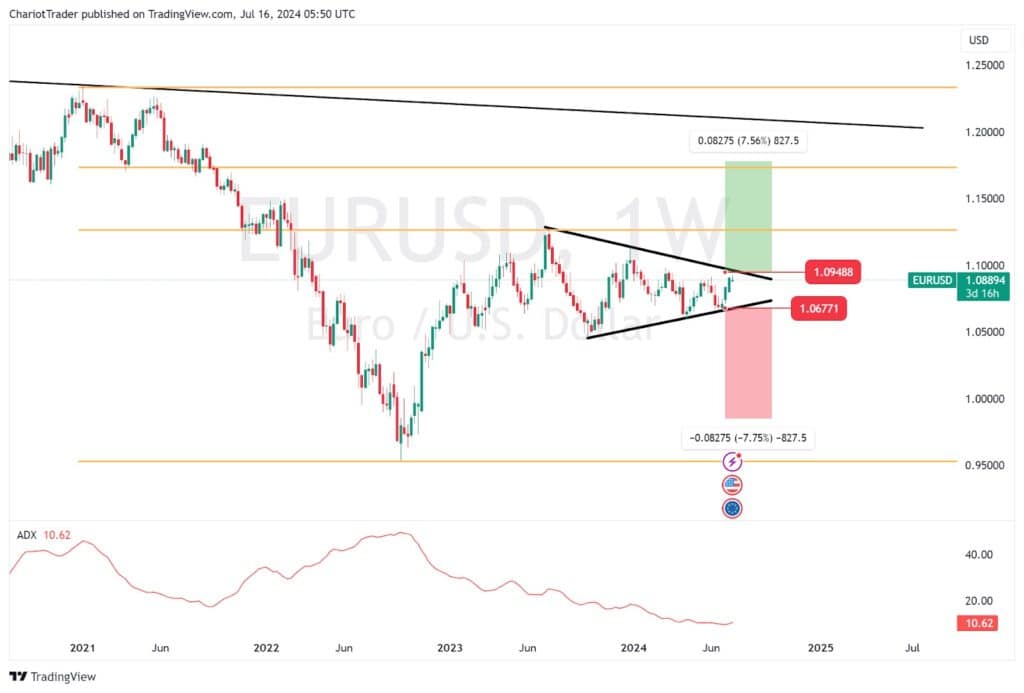
Coincidentally like USOIL, the EURUSD pair has also been in weekly symmetrical triangle pattern since July of last year. Again, the ADX indicator trailing lower helps confirm this as a valid, consolidating pattern.
Assuming a bullish bias, the breakout target is around the 0.618 Fibonacci Retracement level at $1.173. If price declines here, we could see a retest of the lower trendline at approximately $1.0677.
GBPUSD Weekly Triangle (Breaking Out)

GBPUSD has officially broken out of its weekly triangle pattern with a strong weekly candle, and an uptick on the ADX indicator – signaling a true breakout. This marks a potential rise towards $1.381, with a possible retracement back to $1.278 and $1.271 for a retest of the triangle.
AUDUSD Weekly Triangle (Breaking Out)
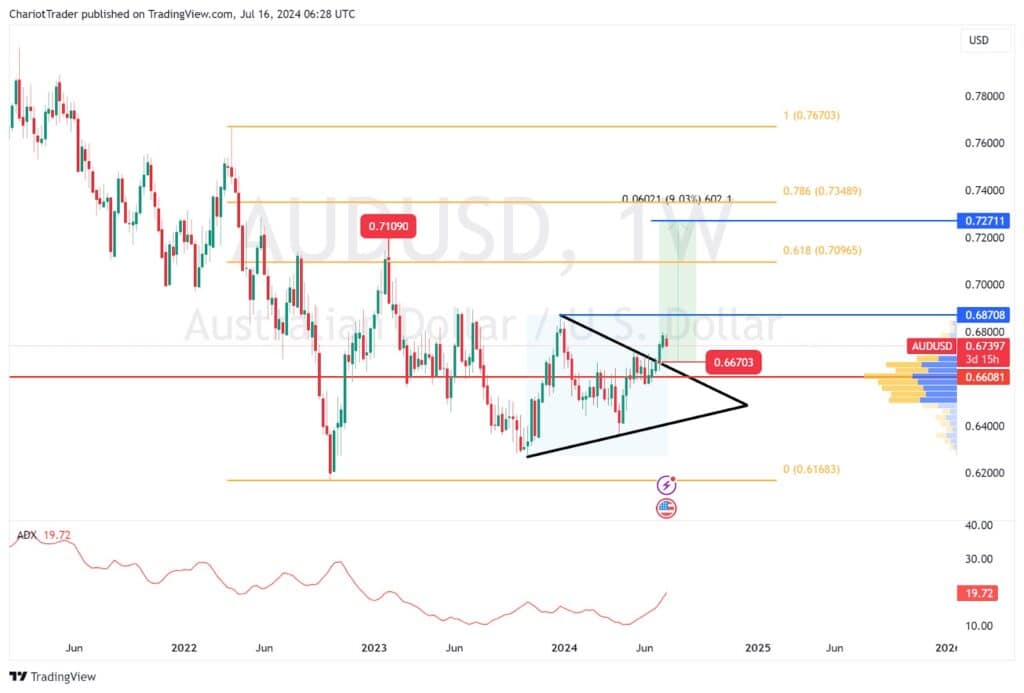
Similarly to the GBPUSD pattern, the Aussie-U.S pair has broken out of a weekly triangle pattern. It has closed two weeks above the pattern with a significant uptick in the ADX, validating the breakout.
With this breakout, we have a potential rise towards $0.728 on the horizon. However, traders must be mindful of the 0.618 Fibonacci level, which aligns with the previous high at $0.711 on AUDUSD.
As per my fellow analyst Zorrays, we are currently sitting at a support level on the 1H timeframe at $0.67300 – $0.67500. However, not all hope is lost if we plummet below this zone; the breakout point of $0.667 and Point of Control at $0.661 should be able to act as a support zone to push AUDUSD higher.
For a more time-sensitive analysis of this trading opportunity, read this Elliot Wave breakdown of the 1H AUDUSD chart.
NZDUSD Weekly Triangle
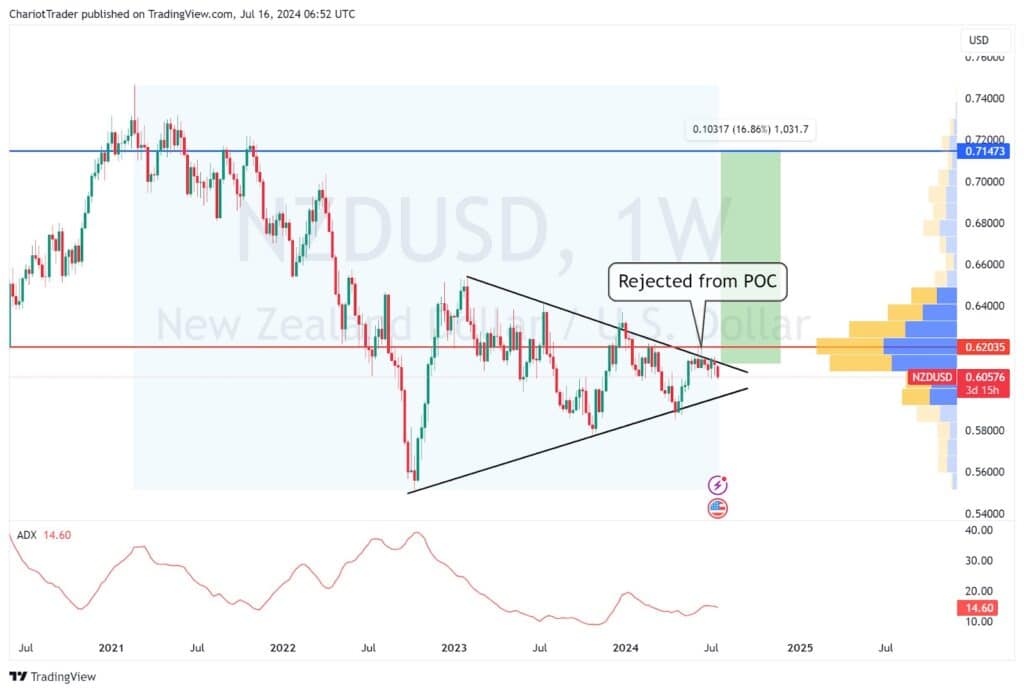
Fundamentally, the Reserve Bank of New Zealand has remained hawkish, while the U.S Federal Reserve has now shifted into a dovish tone. This supports the idea of a bullish breakout, with the target placed at $0.715. With the ADX indicator trailing up, it seems like a breakout is only on the horizon.
Traders should remain cautious, as the Point of Control (POC) is positioned just above the triangle at $0.620. If we can reclaim this level, NZDUSD should be on a smooth trajectory to the upside as there is no significant trading volume up ahead.
Closing Remarks
As markets are forward-thinking, the expectation of a weaker US Dollar is already being priced in. While there will be periods of cooling off, assets paired against the USD should see their prices climbing in the coming days and weeks.
You may also be interested in:
CPI Frenzy: An Overview of July Interest Rates


