- Opening Bell
- September 3, 2024
- 4 min read
ISM Manufacturing in Focus
As U.S. markets reopen after the Labor Day weekend, investors are bracing for potential volatility driven by key economic data releases. The spotlight today is on the ISM Manufacturing Index, a critical gauge of the U.S. manufacturing sector’s health.
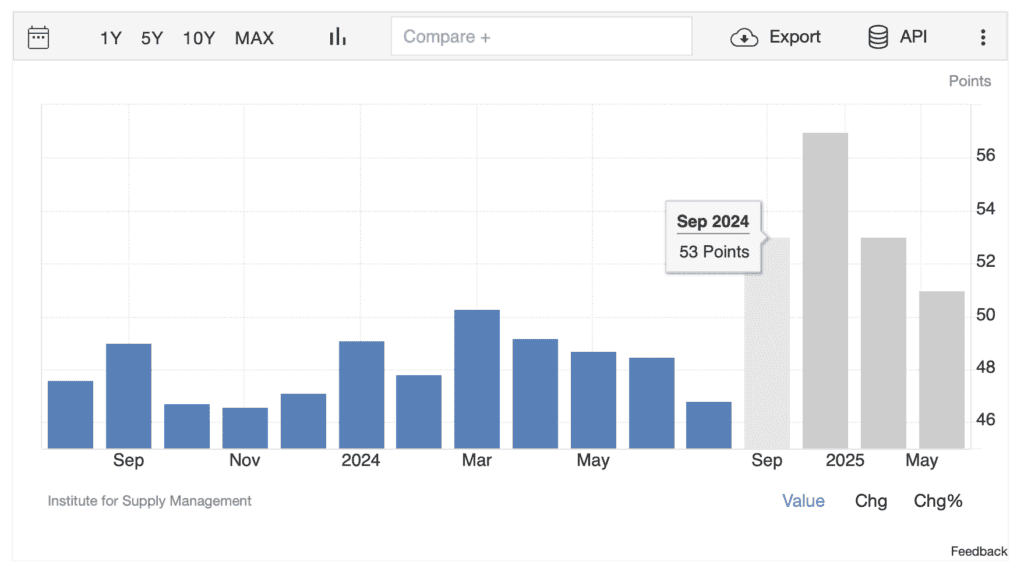
This release is particularly significant because the manufacturing sector has been struggling, remaining in contraction territory—an index reading below 50—since October 2022, except for a brief rebound in March 2023. With the market already anticipating ongoing weakness, today’s ISM data could significantly influence market sentiment and currency movements.
Key Metrics: ISM Manufacturing Index

Source: Trading Economics
Above chart shows that by September the market is pricing in ISM Manufacturing above 50.
Economists expect a slight improvement in the ISM Manufacturing Index for August, with predictions of a rise from 46.8 in July to 47.5. Although this still indicates contraction, any progress toward the 50 mark could be viewed positively. However, a weaker-than-expected result might heighten recession fears and drive the U.S. dollar lower.
A key sub-index to watch is the ISM Prices Paid, which saw a spike earlier this year but has since calmed. The consensus anticipates a decline from 52.9 to 52.0, which could reinforce the belief that inflation is cooling—a key consideration for the Federal Reserve and the markets.
Currency Outlook: Dollar on Edge

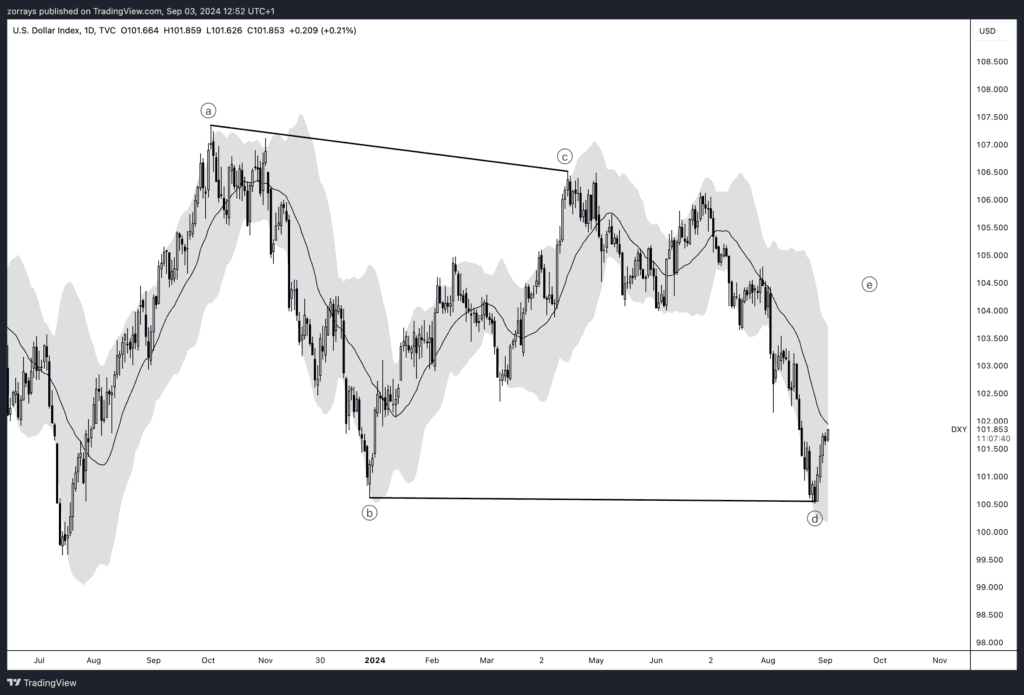
The U.S. dollar is approaching a critical juncture as it moves into the apex of a contracting triangle pattern, identified as wave E. This technical formation suggests a potential short-term correction, with the dollar possibly retracing into the 101.50 to 102.00 range. The dollar has recently touched the middle boundary of the Bollinger Bands, which historically signals the potential for upward momentum toward the upper bound. However, any such move may be followed by a significant downturn, aligning with the broader bearish outlook.
Today’s ISM Manufacturing Index release will be a key factor in determining the dollar’s next move. A weaker-than-expected ISM figure could reinforce recession fears and push the dollar lower, potentially breaking key support levels in the DXY Index. Conversely, stronger data could give the dollar the strength to test the upper Bollinger Band within the triangle, before any significant decline. As technical patterns and fundamental data converge, traders should be prepared for potential volatility in the currency markets.
Stock Market Impact: S&P 500 in the Spotlight

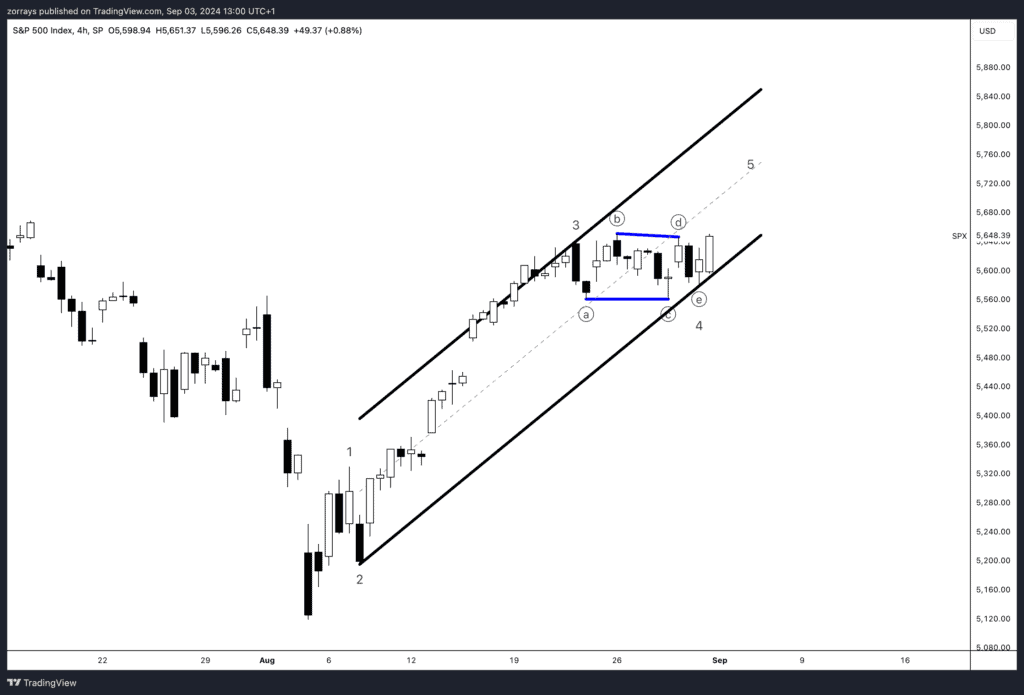
The ISM Manufacturing data will have significant implications for the U.S. stock market, particularly the S&P 500 (SPX). The S&P 500 is currently breaking out of a triangle pattern, suggesting that the index is moving into wave 5 of the Elliott Wave structure, indicating further upside potential in the short term. This breakout aligns with a bullish continuation, which could drive the index higher, especially if the ISM data meets or exceeds expectations, signaling a recovery in the manufacturing sector.
However, with the Federal Reserve expected to cut rates for the first time since the hiking cycle began, this wave 5 could mark the final leg of the current rally. As such, we could be in for a correction looking forward, particularly as markets begin to price in the implications of a dovish Fed stance. Investors should watch the S&P 500 closely, as the resolution of this Elliott Wave pattern and upcoming Fed actions could set the tone for the broader market in the coming weeks.
Looking Ahead: Payroll Data on Friday
While today’s ISM data is critical, traders are also focused on Friday’s payroll report. Our U.S. economist is more cautious than the consensus, expecting weaker job growth, which could further shape the dollar’s trajectory. Until then, the ISM report will be a key indicator to watch.
As the day progresses, the ISM Manufacturing Index will likely drive market movements, so traders should be prepared for potential currency swings as the data is released and analysed.


