


Written by:


- Opening Bell
- April 25, 2024
- 6 min read
Sentiment Mixed as Meta Plunges 14% on Prolonged AI Spending Plan
- Meta Earnings and AI Spend Unnerve Investors
- Google, Meta, Tesla, and Microsoft are Among the Names Reporting
- USDJPY Breaches the 155.00 Mark, Intervention on the Way?
- Oil Slides as US Demand Shows Signs of Weakness Balancing Out Concerns about the Middle East
General Market Outlook
Meta Platforms released their Q1 earnings report following the market close on Wednesday. The Social Media firm and one of the frontrunners in the AI space saw its shares slump around 14% in premarket trade overnight following a lackluster expense and revenue forecast.
Earnings from the Tech sector, particularly the magnificent 7 have been touted as key to US equities continuing their impressive rise this year. There were concerns that valuations may not be justified with Meta up as much as 40% this year, in comparison with the S&P 500’s 6% gain.
Meta Stated it expects expenditure to support investments in new AI products to come in between $96-$99 billion for the year while expecting spending to increase in 2025. The reception to these comments was mixed with many commentators lauding the vision of Meta. Market participants seemed more cautious and sightly unnerved evidenced by the sharp selloff in Meta stock.
The impact of this on US indices saw an end of a two-day recovery for both the S&P 500 and Nasdaq 100. The tech-heavy Nasdaq finished the day down 0.85% with the S&P 500 faring slightly better recording losses of 0.66%. Earnings season continues today with more names from the magnificent 7 releasing their Q1 earnings report. For a more technical outlook on the Nasdaq 100 please read the weekly market outlook posted on Monday.
NASDAQ 100 Daily Chart
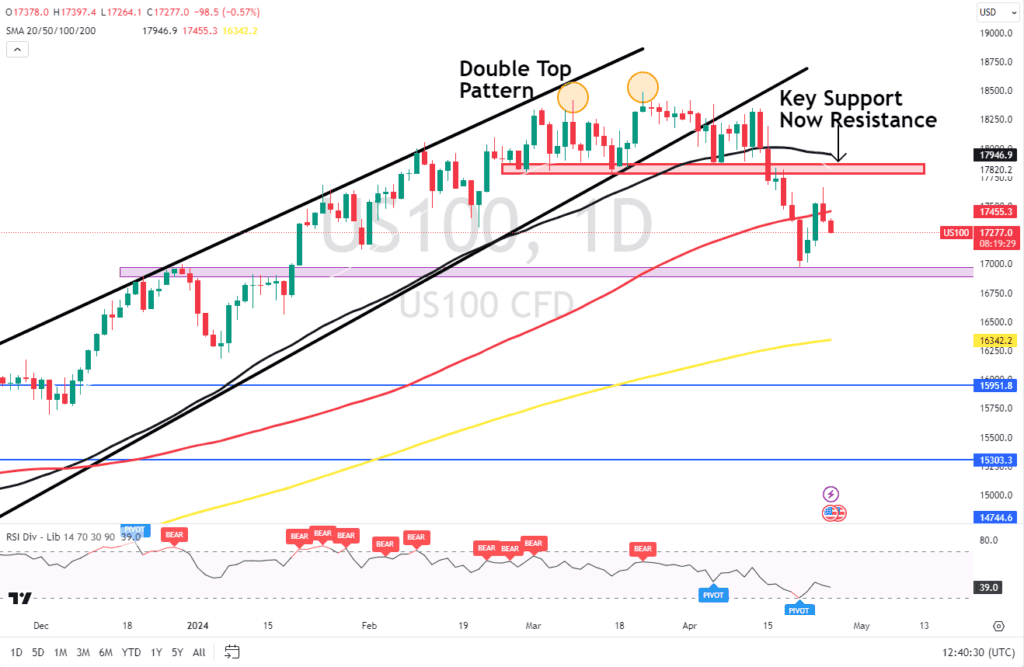
Source: TradingView
Microsoft and Alphabet will release their Q1 earnings reports after the market close today which should provide further hints as to whether the recent decline in US Stocks and tech stocks in particular is likely to continue. Any significant misses or downside adjustments to their outlooks for the rest of the year could weigh heave on tech stocks and drag both the Nasdaq and the S&P 500 lower.
FX Movers: Yen is the Talk of the Town Once More
On the FX front, The Japanese Yen is making waves once more and remains the hot topic in FX circles. Having finally broken the 155.00 resistance handle USDJPY is now trading at fresh 34-year highs with traders wondering when or what will trigger FX intervention by Japanese authorities.
If one thing is certain now, comments about FX intervention etc, will not be enough to arrest the slump in the Yen. Market participants appear to have blocked out such noise as this was an effective tool last year in keeping the Yen supported but so far in 2024, the rhetoric has failed to have the desired impact.
GBPUSD is another pair that has piqued my interest of late following a bounce yesterday as the US Dollar posted marginal gains while the GBP found support in positive UK data. This has pushed GBPUSD to a key inflection point, which could provide market participants with a host of opportunities.
GBPUSD Daily Chart
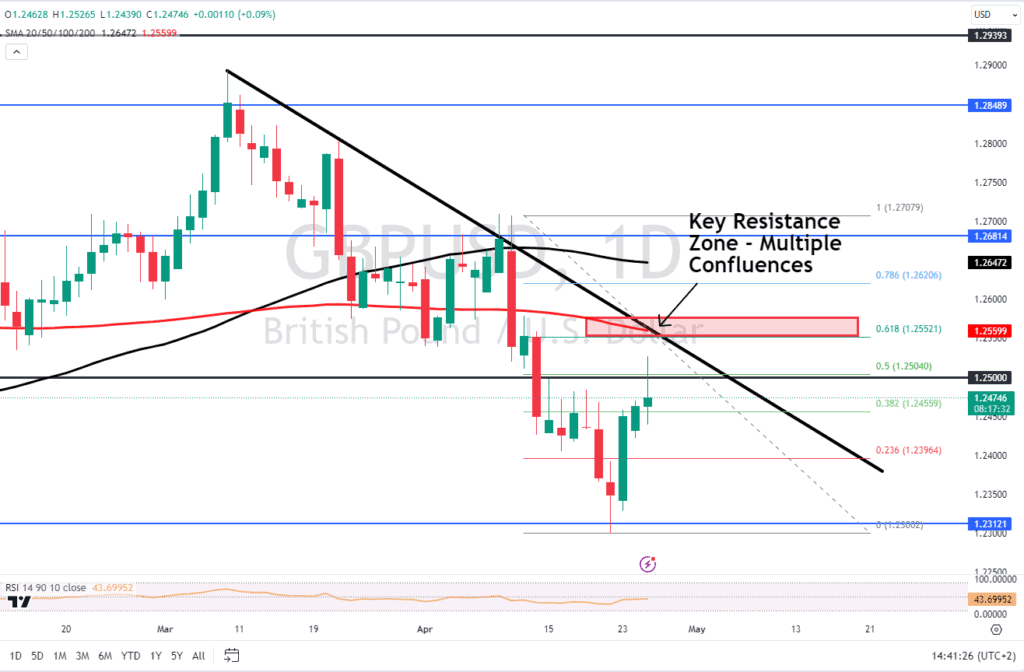
Source: TradingView
GBPUSD has been on a steady downtrend since the beginning of March having topped out around the 1.2890 mark. Since then the pair has been on a steady downward trend posting lower highs and lower lows.
On Monday we saw the price tap the 1.2300 mark before beginning an aggressive recovery to trade just above the psychological 1.2500 mark. Price is now approaching a key resistance level which with multiple confluences which has certainly piqued my interest.
The level around 1.25600 lines up with the trendline, 200-day SMA, and the 61.8% Fibonacci retracement level. This makes the level ripe for some form of reaction. The only gripe I have with another leg to the downside on GBPUSD is that this will be the fourth test of the trendline which usually increases the likelihood that a breakout may occur. The fact that the Fib retracement level and moving average are at this level as well does make this even more intriguing with a break above the trendline facing resistance at the 1.2620 levels before another key area of resistance comes into focus around the 1.2681 handle.
Commodities
WTI Oil found support this week near the key $80 a barrel mark but yesterday’s data out of the US has kept further upside. The supply report released by the EIA on Wednesday showed signs of slowing demand with inventories also falling sharply last week. Oil prices have remained steady as it appears that US demand concerns are offsetting any concerns around supply interruptions as a result of the conflict in the Middle East. Any change in the Middle East however on either front, a ceasefire or a threat of a wider war could catalyze Oils’ next move.
Gold has been the biggest loser this week following the improvement in sentiment and easing of tensions in the Middle East. The precious metal briefly dipped below the $2300/oz level before bouncing back to $2330/oz before entering what appears to be a period of consolidation. The US dollar could be the main driver of Gold prices for the remainder of the week now that safe haven appeal has waned.
GOLD 4H Chart
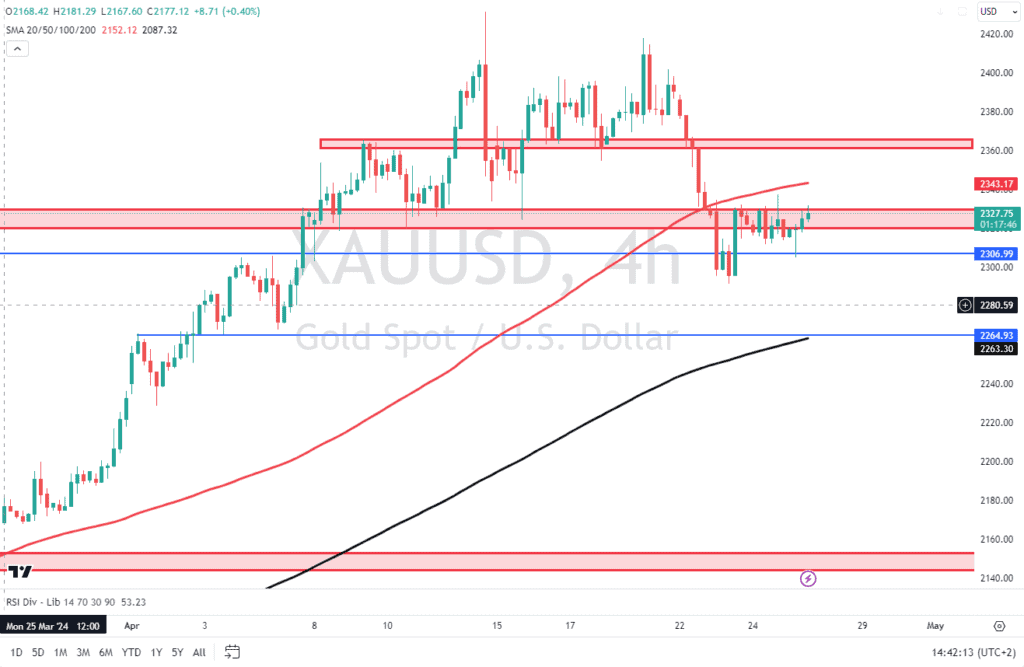
Source: TradingView
Looking at the 4H Gold chart above, we are sitting at a resistance area and threatening a break higher which would bring the 100-day SMA into focus around 2343. A push beyond this level will run into another area of resistance resting around the 2362 area.
Alternatively, a push to the downside faces support around the 2306-2300 region before a key confluence area around 2264 comes into focus.
Economic Data and US Earnings Ahead
Looking ahead to the rest of the week, and we still await a lot of key US data with Q1 GDP data and pending home sales numbers today followed by the FEDs preferred inflation gauge the PCE data out tomorrow. Personally, i think the PCE data will be key for how markets price the potential for rate cuts later this year and could have a much larger impact than the GDP print.
Economic Calendar for April 25, 2024. (UK Time, GMT + 1)
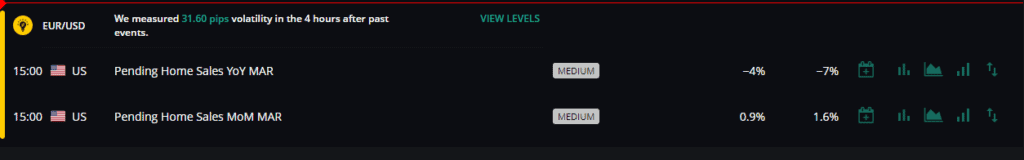
Source: FXIFY


