- Opening Bell
- November 26, 2024
- 4 min read
RBNZ Projected to Cut the Kiwi, AUD Inflation Projected Higher
Inflation is projected to climb higher in Australia, while the Reserve Bank of New Zealand (RBNZ) is planning to cut 50 basis points from its current cash rate. This creates a dynamic where:
- The Reserve Bank of Australia (RBA) remains steadfast on holding rates at 4.35% until May 2025.
- The Reserve Bank of New Zealand may lower its cash rates from 4.75% to 4.25%, making it lower than RBA’s cash rates.
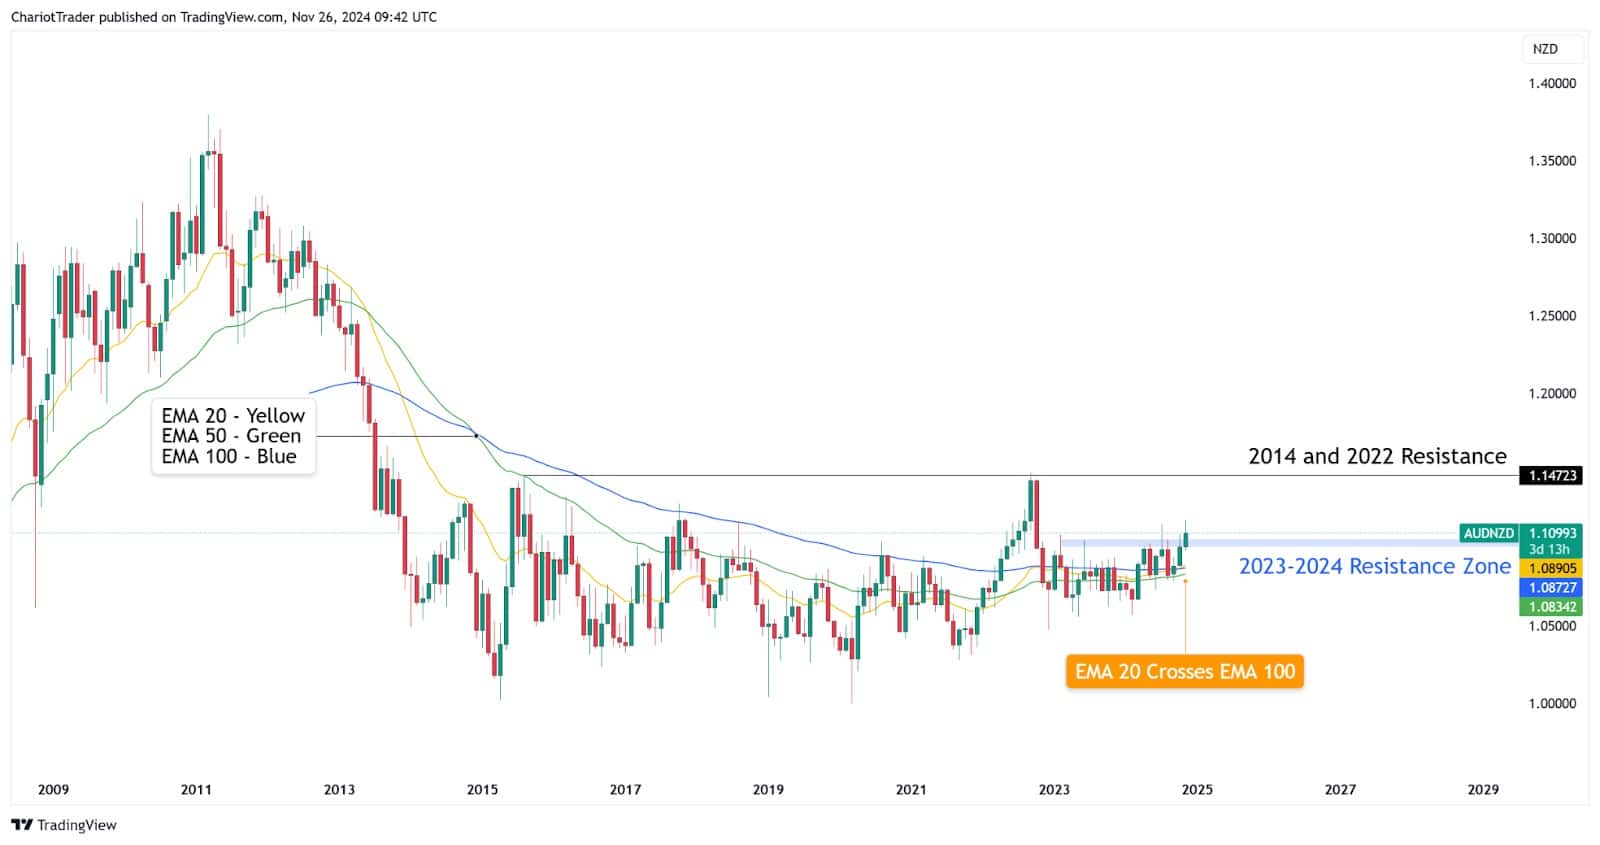
In light of this rate cut expectation, the Aussie-Kiwi Pair is seeing a climb towards $1.147 NZD, major highs seen in 2014 and 2022. Meanwhile, the Aussie-Dollar is continuing its monthly bearish price action, and the Kiwi-Dollar appears to be ranging.
Australia CPI Y/Y Data Projected to Rise by 0.4%
The Australian Consumer Price Index (CPI) Year-Over-Year Data is also projected to be 0.4% higher than its previous year; climbing from 2.1% to 2.5%. This incentivises a continued rate hold for the RBA for the purpose of cooling off inflation.
| Verdict: Fundamentally Bullish for Aussie-Dollar and Aussie-Kiwi. |
AUD/USD Still Under 13 Year Trendline, Inside a Triangle Pattern

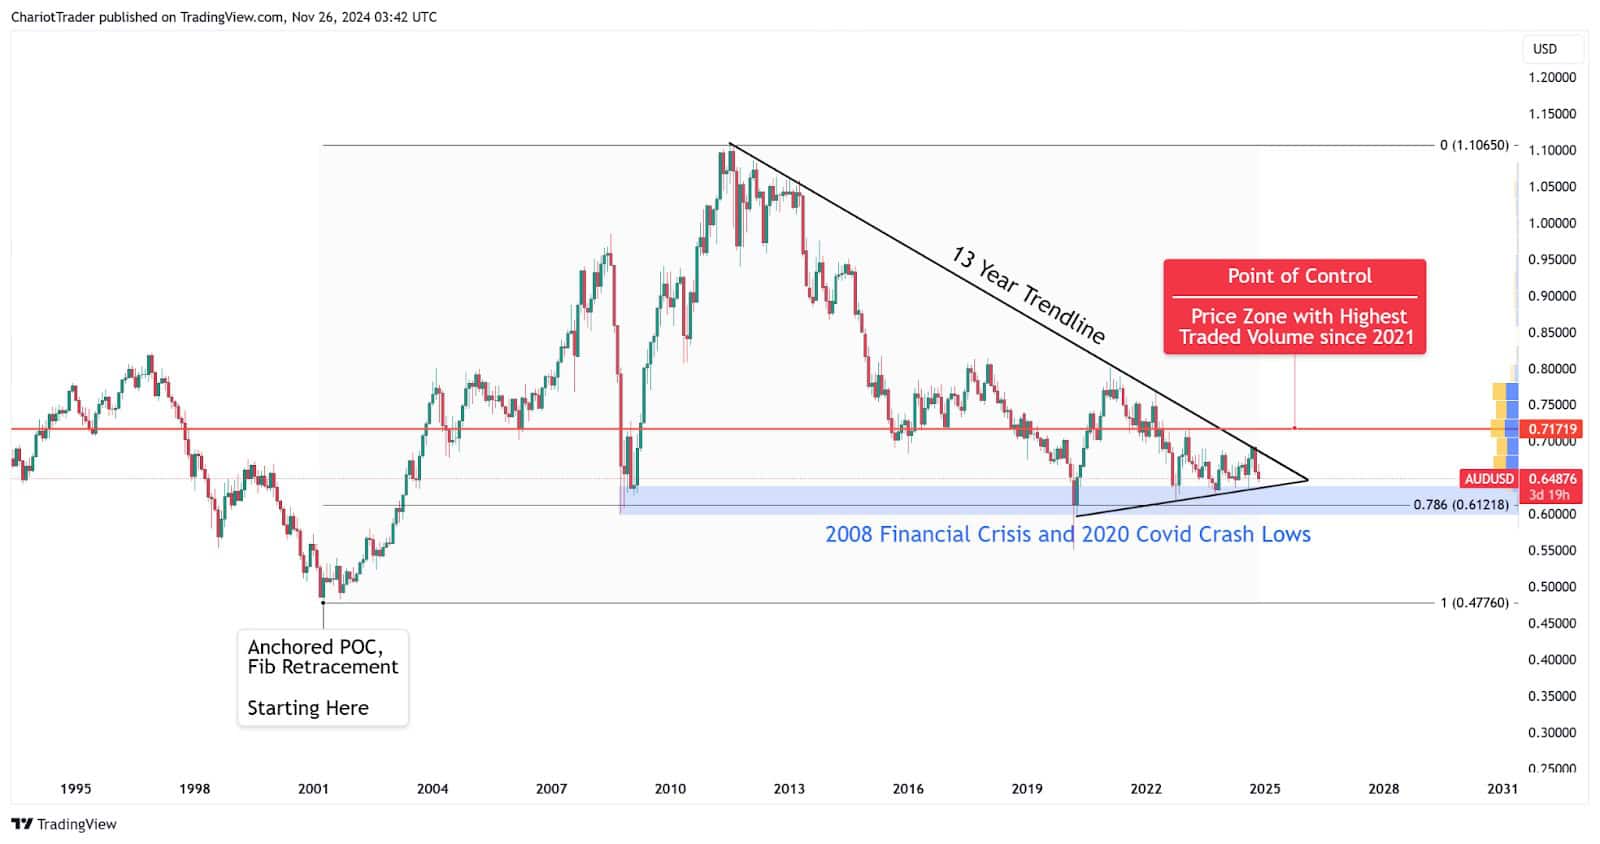
The projected CPI up-creep is bullish for Aussie-Dollar, but the overall technical trajectory at the moment is down – unless the 13 year trendline is broken. Currently, AUD/USD is trailing lower and reapproaching the critical support zone at $0.5974 – $0.6393, which held up AUD/USD during major crashes in 2008 and 2020.
Additionally, AUD/USD appears to be inside a Symmetrical Triangle Pattern, so the lower support trendline could potentially prop up the price if retested.
Outlook Hinges on Fed Rate Decision

The mid-term outlook is leaning bullish but hinges on whether the US Federal Reserve decides to hold rates or cut them. Since the RBA has already expressed an interest in holding rates until May 2025, if the Federal Reserve decides to pause their rate cuts, the AUD/USD may struggle to regain bullish momentum.
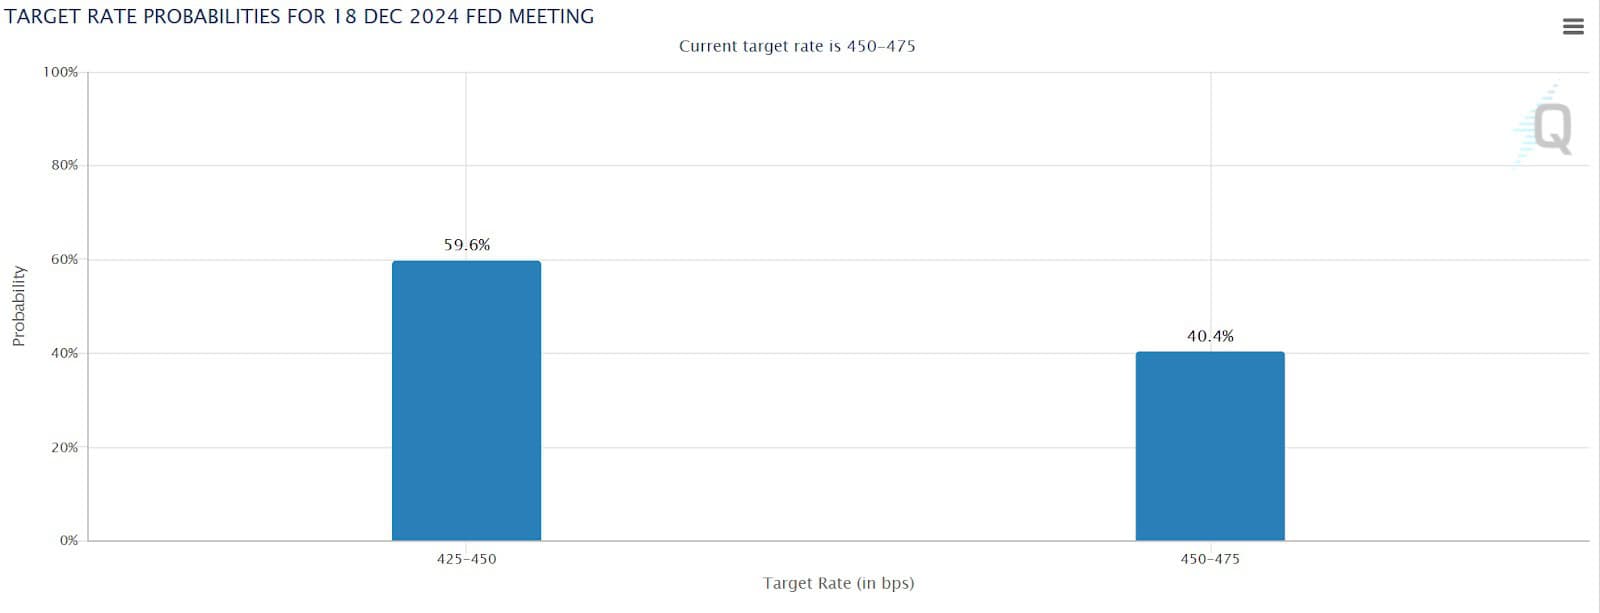
Recently, there has been a shift in rate expectations, with the FedWatch Tool now indicating a 59.6% probability of a rate cut and a 40.4% probability of a rate hold, as of November 26th, 2024.
With US interest rates currently at 4.75%, they remain stronger compared to the Australian Dollar’s rate of 4.35%. If the Fed opts to hold rates at the upcoming December 18th meeting and signals a hawkish stance – i.e. a “watch and see” approach, the asset may struggle to bounce at key support levels.
AUD/NZD Monthly Technical Analysis

AUD/NZD has seen a strong November, and now poses the possibility of closing above a monthly resistance zone ($1.1007 – $1.1066 NZD), formed between 2023 to 2024.
With this bullish indication comes another: the Monthly EMA 20 may be crossing above the Monthly EMA 100 for the first time on AUD/NZD. For the past 10 years, the monthly EMA 20 has always been below the monthly EMA 100.
For this signal to be complete, we need EMA 20 to stay above the EMA 100 as we close November, which would indicate the potential for a significant trend shift.
Fundamentally, AUD is mid term bullish because the RBA has expressed an interest to hold 4.35% rates until May 2025. Meanwhile, NZD is short-term bearish as the RBNZ is expected to cut rates to 4.25%, resulting in a lower cash rate.
NZD/USD Monthly Technical Analysis

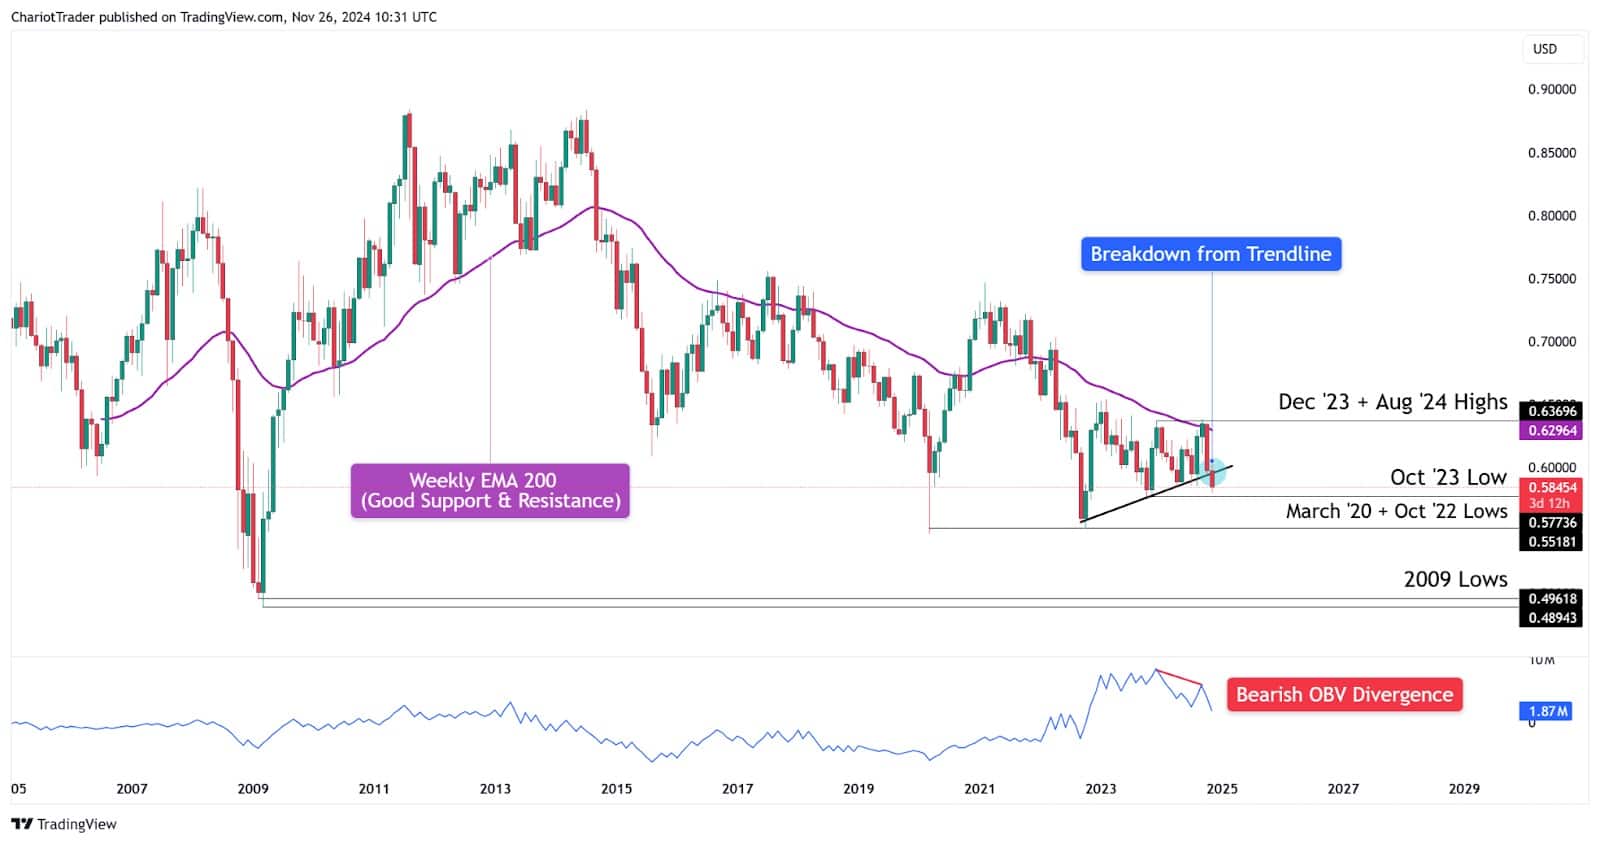
NZD/USD is currently struggling with holding above the Weekly EMA 200 (Exponential Moving Average), which has served as a powerful support and resistance indicator on this asset. Beyond that, we can see that NZD/USD has been in a downtrend since 2014, creating lower highs and lower lows consistently.
NZD/USD is also coming off a brutal rejection from the Weekly EMA 200 in September, combined with monthly bearish divergence on the OBV indicator.
With the recent rate cut projection, NZD has taken a slump towards the downside, and broke an ascending trendline.
This makes the next targets for the asset these areas – October 2023 Pivot Low ($0.5773), March 2020 + October 2022 Lows ($0.5774), and the 2009 Lows ($0.4893 – $0.4962).
You may also be interested in:


