- Opening Bell
- January 9, 2025
- 2 min read
S&P500: Growing Vulnerability to Correction Amid Wave B Triangle
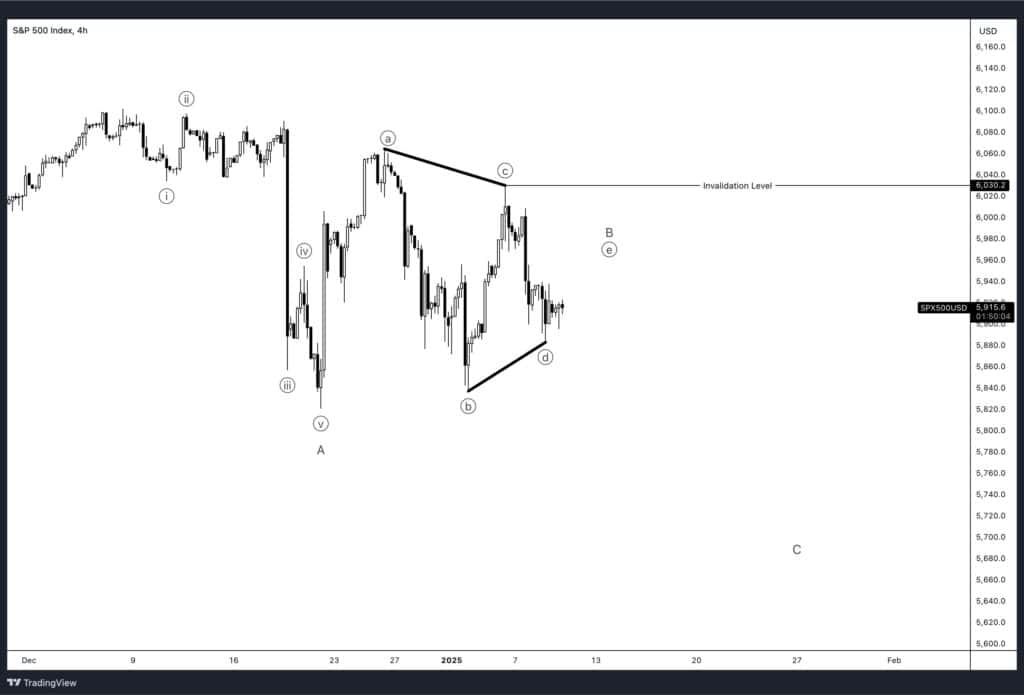
The S&P 500 is showing increasing signs of corrective behaviour, suggesting that a short-term pullback could be on the horizon. According to the Elliott Wave structure visible on the chart, Wave A has likely concluded, and the market is currently playing into a Wave B symmetrical triangle. This formation is characterised by converging price action, reflecting indecision and consolidation as the market prepares for the next move.
The invalidation level for this wave count sits at 6,030. A decisive break above this level would invalidate the current scenario, forcing a reassessment of the wave structure. Until then, the triangle within Wave B remains the dominant outlook.
Technical Analysis: The Wave Structure

- Wave A Completion: The sharp decline seen in December marked the likely conclusion of Wave A. This initial leg down sets the stage for a broader corrective structure.
- Wave B Triangle: The price is now consolidating within a triangle pattern, with successive higher lows and lower highs. This reflects indecision and creates the potential for a breakout.
- Invalidation Level: The key level to watch is 6,030. A break above this would invalidate the current count and suggest a different corrective structure or possibly a resumption of the uptrend.
- Wave C Expectations: If the Wave B triangle resolves to the downside – as is typical in Elliott Wave patterns – Wave C would follow, potentially driving the S&P 500 lower into the 5,700–5,600 region.
Broader Market Outlook
Despite the short-term risks, equity markets are expected to make progress over the course of the year. Gains are likely to be driven by a combination of earnings growth and resilient economic performance. However, corrections are a natural part of market cycles, and the current environment leaves room for potential setbacks.
Conclusion
The S&P 500’s current wave structure suggests a growing likelihood of a corrective phase before resuming its broader upward trajectory. While risks such as higher bond yields and weaker data may weigh on the market in the short term, long-term prospects remain constructive. Traders should keep a close eye on the 6,030 invalidation level and prepare for potential volatility as the market navigates its next phase.
Key Levels to Watch:
- Resistance: 6,030 (invalidation level)
- Support: 5,700–5,600 (Wave C target if the triangle resolves lower)
By staying informed and agile, traders can better navigate this period of uncertainty and position themselves for the opportunities that lie ahead.


