Written by:

- Opening Bell
- May 8, 2025
- 3 min read
“We Can Be Patient” — Powell’s Words Crush June Rate Cut Hopes
JUST IN — May 7 FOMC Turns Hawkish
The tone from May 7th’s FOMC press conference marked a sharp contrast to the March 20th FOMC, where policymakers still projected two rate cuts in 2024 via the Summary of Economic Projections (SEP). Now, with Chair Powell emphasising a “wait-and-see” stance amid rising inflation and unemployment risks, markets are rapidly repricing expectations.
👉 What’s next for stocks and forex?
Volatility is back on the table, with USD bulls reawakening and equities hesitating near key technical levels.
June Rate Cut Expectations Drop Drastically — 68% to 23.9%
A week ago, the Fedwatch Tool projected a rate cut expectation of 68% on June’s FOMC rate decision day. However, like a knife cutting through butter, these expectations have fallen by 44.1 percentage points after the May press conference.
| Time Stamp | June Rate Cut Probability |
| 1 week ago | 68.0% |
| After May press conference | 23.9% |
| Change | ▼ 44.1 percentage points |
Quick Summary of Powell’s Speech and Replies to Media
The market’s negative read came down to Powell’s tone and the message between the lines.
First, he notably ducked any effort to reaffirm the two-cut outlook for 2025—dodging questions and deferring guidance until the June SEP. That alone was enough to rattle expectations.
Then came the emphasis: the Fed’s firmly planted in “wait-and-see” mode. Powell underlined patience, flagged increased downside risks, and made clear they’re in no rush.
His repeated line? Policy is in a “good place”—a signal that they’re holding rates unless data forces their hand.
Add to that a fresh warning: the Fed sees elevated risks of both higher inflation and higher unemployment in 2025, with tariffs now cited as a potential accelerant. Powell called the inflation impact “possibly persistent,” depending on passthrough speed and expectations.
For now, he sees no real stress in the data—just rising concern in sentiment. But that disconnect only fuels uncertainty.
DXY Chart Analysis
For now, DXY still remains in bearish control. It’s repeatedly rejecting the Daily EMA 20 (Exponential Moving Average), and also at prior broken lows; highlighted by the red boxes.
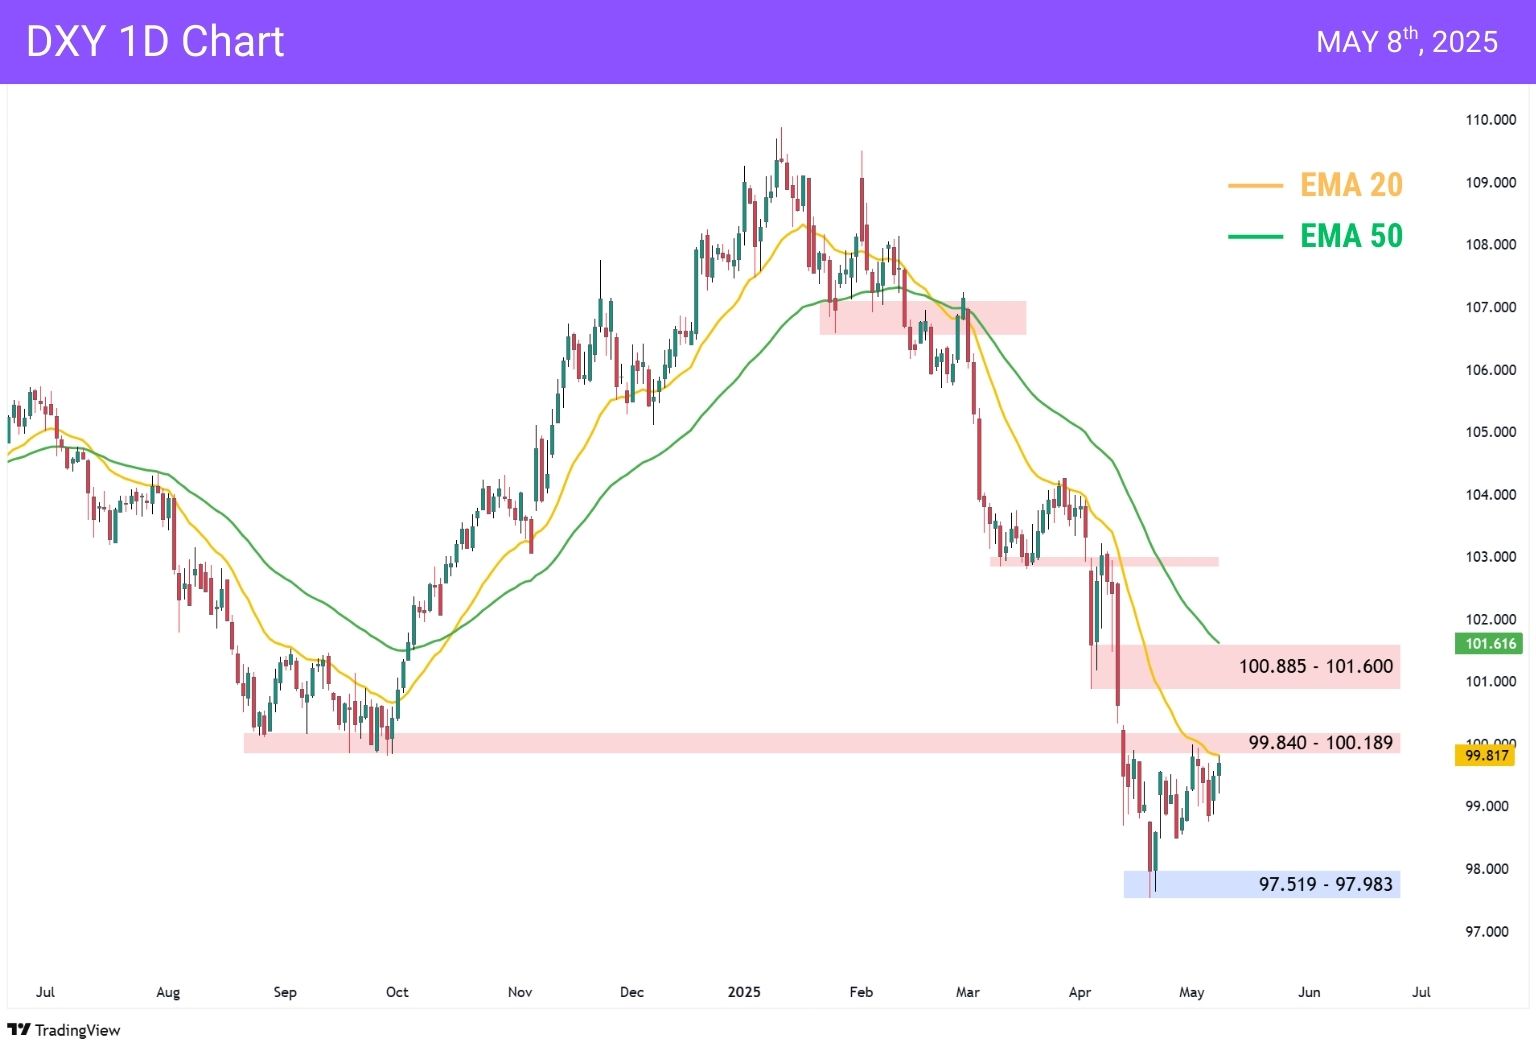
- The closest rejection point to watch is the EMA 20 at 99.820, which aligns with prior lows at 99.840 – 100.189.
- If DXY is rejected here, we can first expect a test of the lows at 97.519 – 97.983, potentially forming a range.
SPX Chart Analysis
The SPX is interesting — on one hand, we saw a massive recovery after dipping into support at $5,000. On the other, we witnessed a market structure break on the weekly timeframe (Lower Low formed), and we’re currently trading at resistance.
Basically, we’re at a fork in the road – with SPX having the potential to move in either direction.
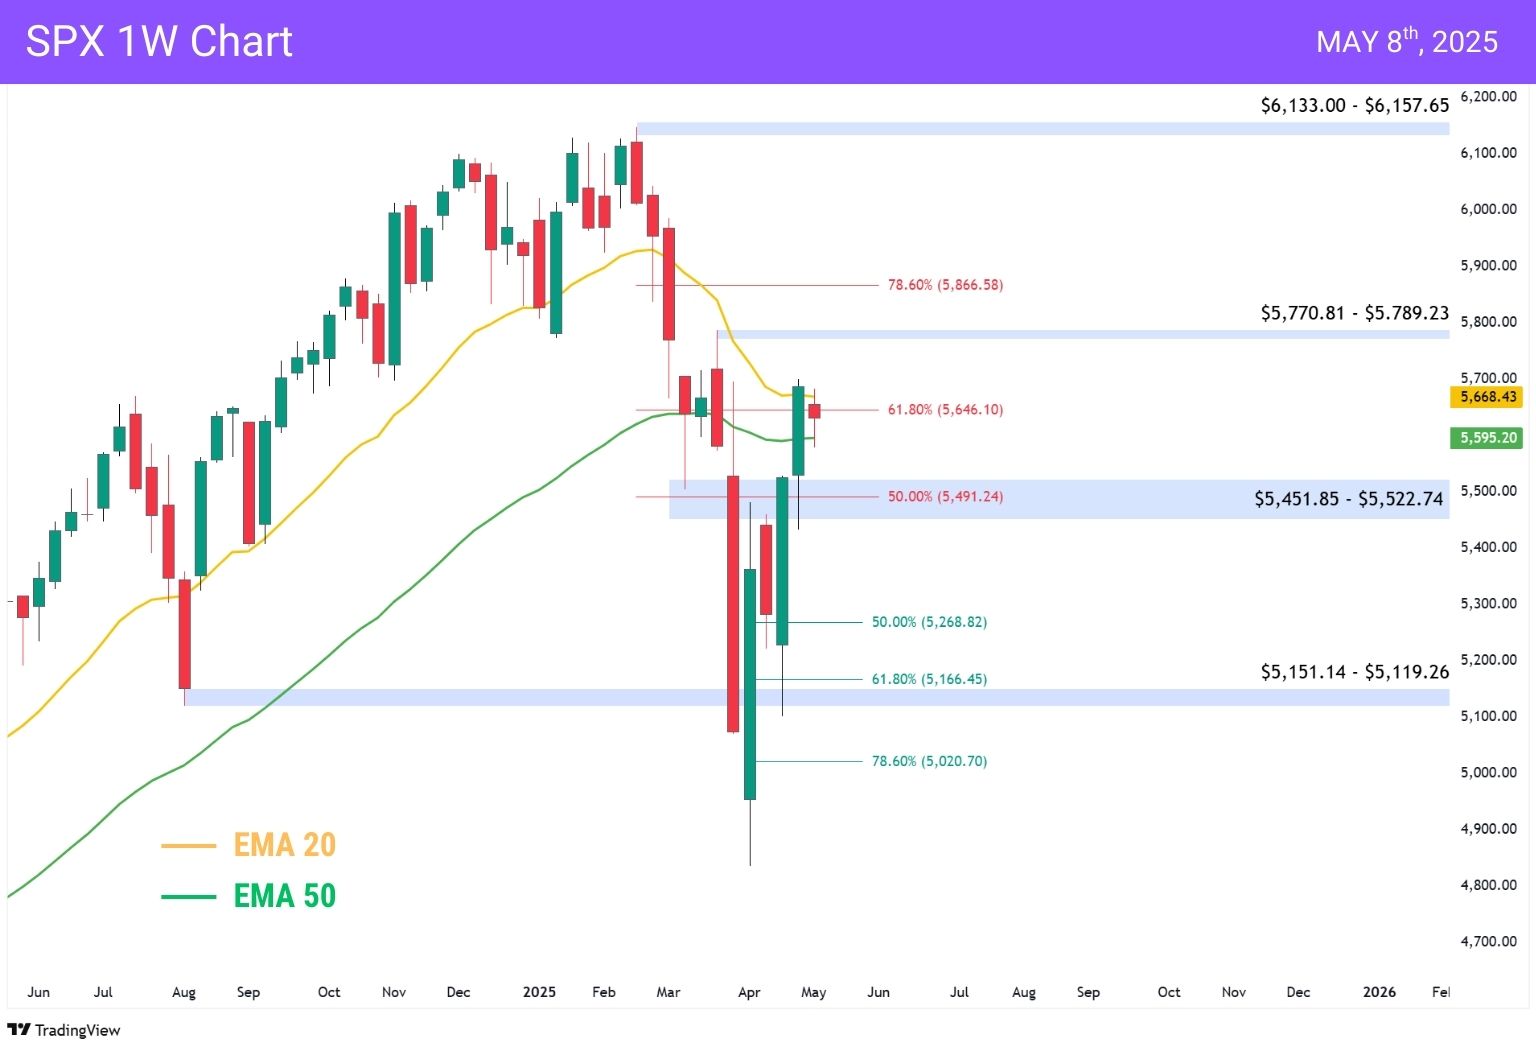
- Watch for a potential bearish weekly close below the 61.8% Fib ($5,646) and Weekly EMA 20.
- A rejection here could see SPX retest daily support at ~$5,450, or lower at $5,150 – $5,165.
- Bearish fib retracements marked in red, and bullish fibs marked in green.
Depending on how the week closes (push above EMA 20 or below), we could anticipate the SPX’s next move. A fall below the ~$5,450 region would open us up for bullish retests at the 61.8% fib level, which aligns with the August 2024 lows.
Bottom Line
- Fed Tone: A clear wait-and-see posture, which is perceived negatively in context of March FOMC’s dovish outlook.
- Powell deferred responsibility to the government, pointing to tariffs and fiscal policy as the primary forces now.
- DXY: Weak but stable, no trend change until breakout.
- SPX/NASDAQ: Bullish momentum short term, but at risk of pullback from overextension and heavy retail FOMO.
You may also be interested in: