


Written by:


- Opening Bell
- July 15, 2025
- 3 min read
DXY Breaks Falling Wedge After June CPI Meets Expectations | Bullish Dollar Breakout Explained
June CPI Report and FX Market Setup
This week began quietly in FX markets, but momentum shifted decisively following the release of the U.S. June Consumer Price Index (CPI). Traders had priced in modest volatility, anticipating the print to hit the 0.3% month-over-month consensus. As it turns out, that’s exactly what happened — but the market reaction has been anything but muted.
Adding fuel to this shift were broader macro narratives, including softer-than-feared Russian sanctions and China’s stronger-than-expected Q2 GDP, which both leaned into a slightly risk-positive backdrop.
All eyes were on the U.S. dollar index (DXY), which had been consolidating inside a falling wedge pattern. With the CPI print confirming expectations, the DXY broke out of the wedge in textbook technical fashion — a potentially bullish signal for the greenback going forward.
What the June CPI Report Revealed
Key Inflation Figures (0.3% MoM)
The Bureau of Labor Statistics reported that U.S. consumer prices rose 0.3% in June, exactly in line with market forecasts. This outcome marked a continuation of the disinflationary trend, albeit with some stickiness in core inflation components like housing and services.
Immediate Market Reaction Across Asset Classes
- DXY surged on the news, as bond yields ticked up slightly, and expectations for a September rate cut diminished.
- Equities edged higher, aided by the “as expected” print that reassured risk markets.
- Gold prices retreated, and USD/JPY rallied, reflecting renewed USD strength and rising yield differentials.
Technical Analysis – DXY Breaks Falling Wedge
What is a Falling Wedge Pattern?
A falling wedge is a bullish reversal pattern formed by converging trendlines that slope down. It suggests a slowdown in bearish momentum, with potential for a breakout higher once resistance is breached.
DXY Technical Setup Before the Breakout
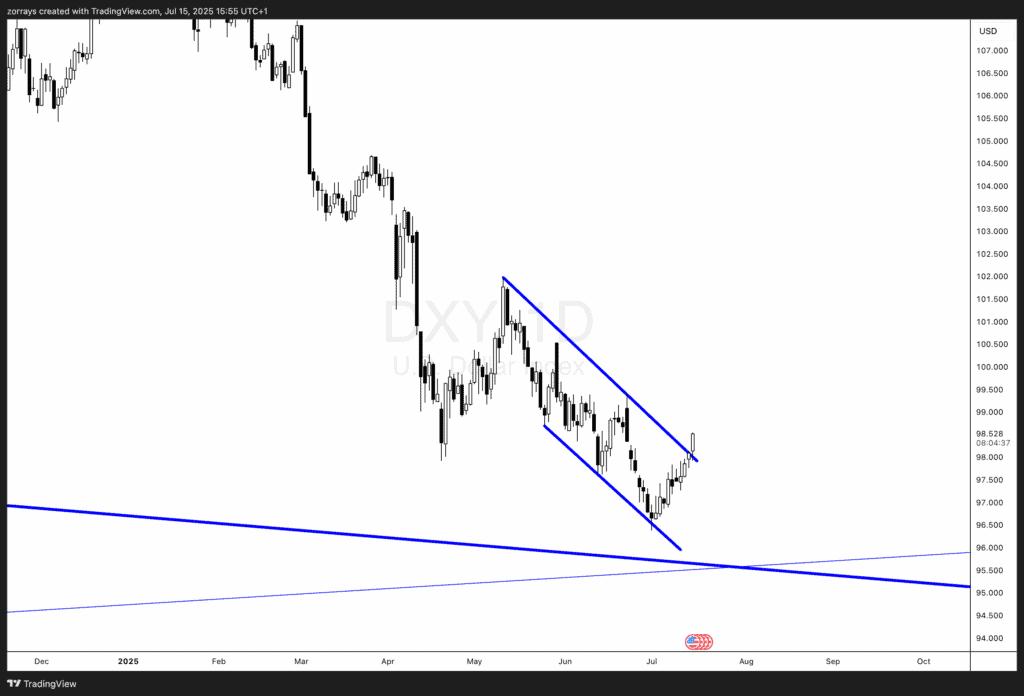
Over the past two months, the DXY was tracing a clear falling wedge on the daily chart — marked by lower highs and lower lows. As we approached July, the price action began to compress, with a base forming near 96.80–97.00.
Confirmation of Breakout and Implications
As seen in the chart, today’s candle has decisively broken above the upper trendline of the wedge.
A measured move from this pattern points to potential upside toward 100.50–101.00, assuming the breakout sustains.
Fed Policy Outlook Post-CPI
Market Pricing Before vs. After the Report
Before the CPI release, markets priced in 16 basis points of Fed easing by September — implying a small but non-zero chance of a cut. Post-CPI, that easing probability is diminishing as sticky inflation persists, albeit at manageable levels.
Why the 16bp Easing May Be Priced Out Soon
With core inflation remaining elevated and labor markets strong, the Fed may lean toward patience. A strong dollar post-CPI aligns with expectations that any rate cuts will likely occur later in 2024 or early 2025 — not imminently.


