- Opening Bell
- October 29, 2024
- 5 min read
Australian Pairs May Move Lower: CPI Data Release Coming Up
The Australian dollar looks poised for bearish moves in the days ahead, but that could change if upcoming economic data beats expectations. Positive surprises in key indicators might alter the tone for AUD pairs, leading to a potential reversal of this bearish outlook.
As fresh data rolls in, all eyes will be on the Aussie to see if it can overcome current headwinds and reclaim a stronger position in the forex market.
Australian Consumer Price Index (CPI) data releases on October 30th at approximately 12:30AM UTC time:
| Data | Forecasted | Previous |
| CPI q/q | 0.3% | 1.0% |
| CPI y/y | 2.3% | 2.7% |
| Trimmed Mean CPI q/q | 0.7% | 0.8% |
The current rate of the RBA is 4.35%, and the bank is currently adopting a Wait-And-See approach. If statistics come in as forecasted or even lower, they should encourage the RBA to look towards rate cuts; therefore weakening the Aussie Dollar and its Forex pairs.
Why Does Lower CPI Lead to a Weaker AUD?
A lower Consumer Price Index (CPI) signals inflation is cooling, which immediately lowers the pressure on the Reserve Bank of Australia (RBA) to keep rates high. As CPI y/y moves closer to the RBA’s target of 2-3%, the bank can hold off on further hikes. This pause tends to pull foreign investment away from the AUD as investors chase higher returns in more hawkish economies.
As a result, lower CPI dampens demand for the AUD, pushing the value of AUD pairs lower in Forex markets – especially in AUD/USD, AUD/NZD, AUD/JPY, where central banks are maintaining or increasing rates.
AUDUSD Analysis
Current US rate is 5.00%, while AU rate is 4.35%.
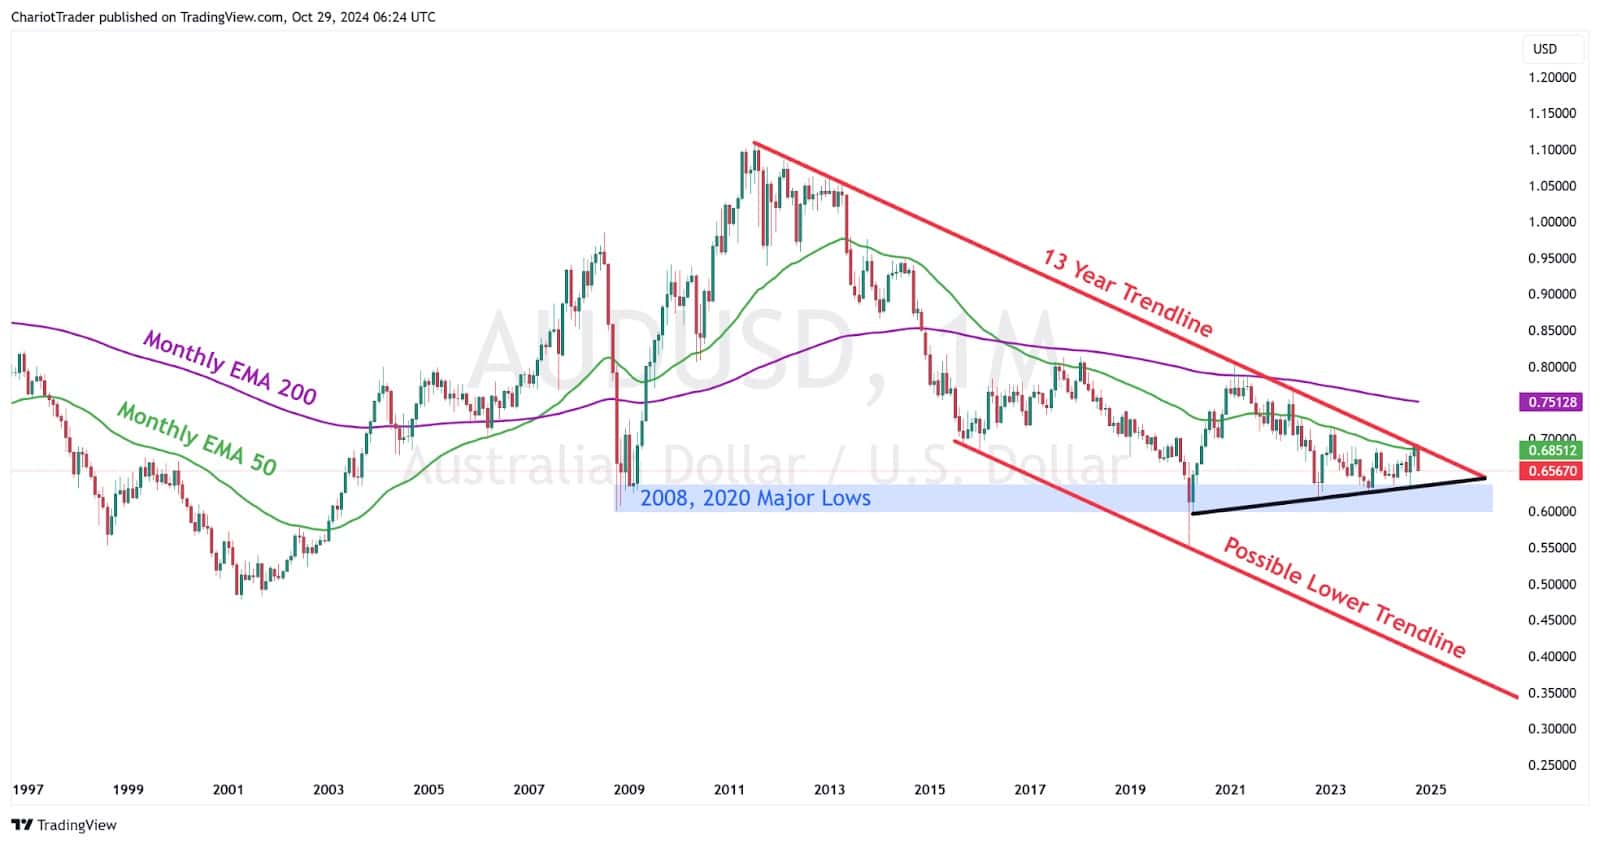
Taking a snapshot of the AUD/USD Monthly Chart, we can see the price react heavily to a 13 Year Old Trendline which acts as resistance. This trendline aligns with the Monthly EMA 50, which is equal to the Weekly EMA 200.
On the lower end, there is a rising trendline, and a support zone formed by the 2008 – 2020 Major Lows ($0.5974 – $0.6393). If both levels are broken, there is a looming possibility of a lower trendline, which would form a descending parallel channel.

The Monthly 50 and 200 EMAs are well respected dynamic S/R levels, and should not be ignored. Looking back, you’ll see how the price has made clear pivots from these Exponential Moving Averages (EMA) in the past. If AUD/USD wants to flip bullish, it must overtake the EMA 200 and hold the price above, until EMA 50 begins to trail up.
AUDNZD Analysis
Current NZ rate is 4.75%, while AU rate is 4.35%.
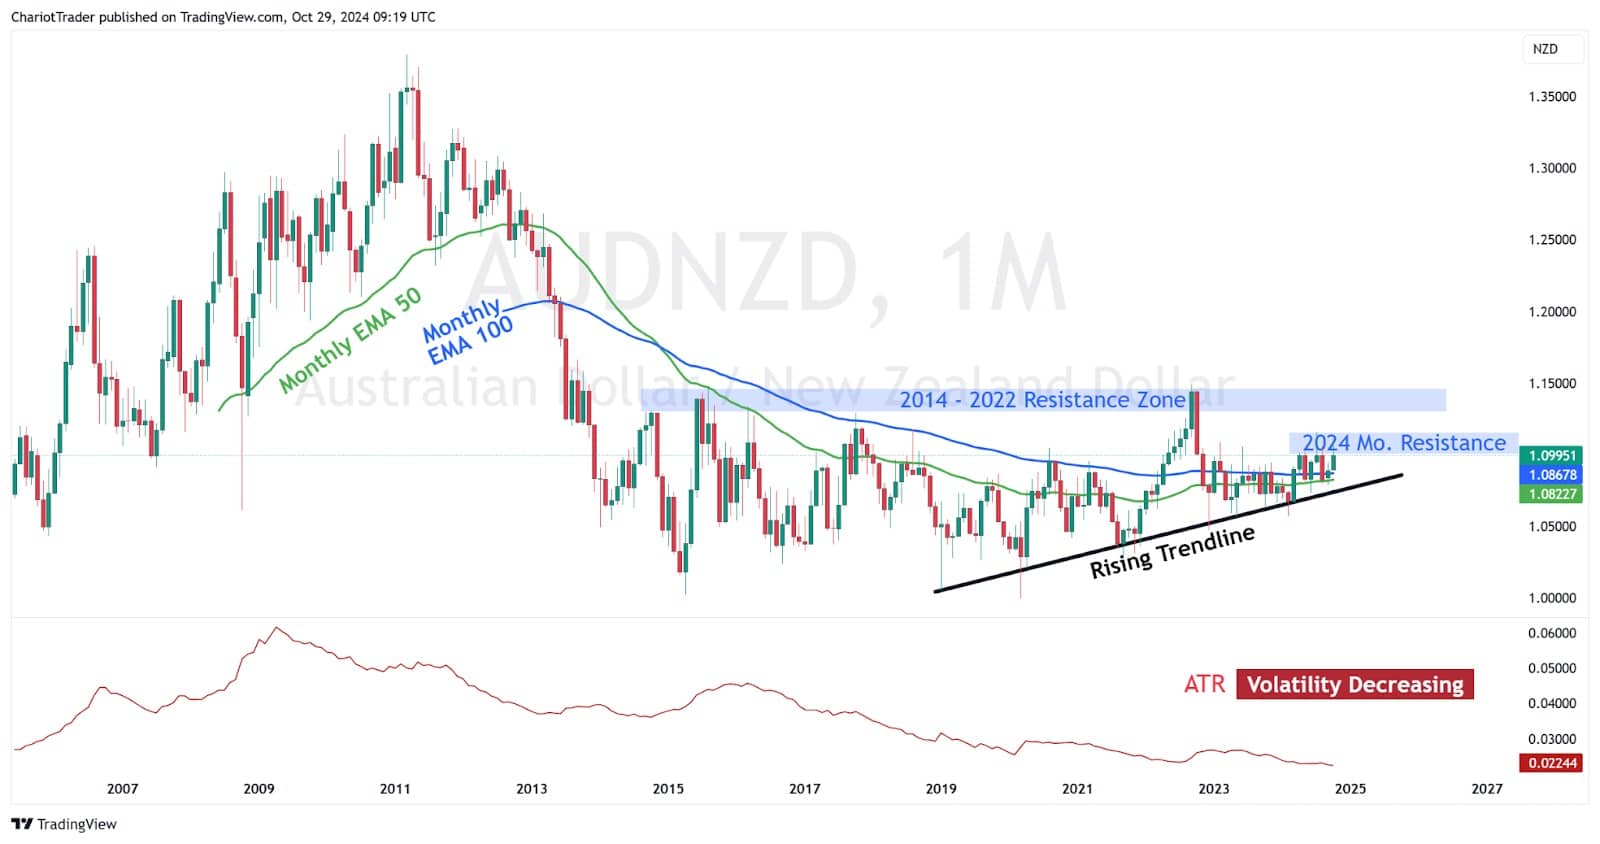
AUD/NZD has been contracting in volatility since 2009, where the asset first saw a large move to newer highs, halting in 2011 and trending down ever since.
On the monthly chart, we’re able to see that the Monthly EMA 50 and 100 tend to serve good dynamic levels to watch for pivots; albeit with a condition:
- When EMA 50 is over EMA 100, they are respected as support.
- When EMA 50 is under EMA 100, they are respected as resistance.

Currently, the October monthly candle is rejecting from a zone that has consistently acted as resistance in all of 2024 ($1.1000 – 1.1160). It needs to get over the 2024 Monthly Resistance before trending higher to test the 2014 – 2022 Resistance Zone at approximately $1.1295 to $1.1469.
With lower interest rates, and the potential for further rate cuts, AUD/NZD could trend lower in coming days.
AUDJPY Analysis
Current JP rate is 0.25%, while AU rate is 4.35%.
The Bank of Japan has signaled that they are interested (no pun intended) in hiking their interest rates before December 2024. With this in mind, AUD/JPY could begin to trend lower despite that AUD is a greater hold than JPY.
Keep in mind, the news we’re getting now is that:
- BOJ (Bank of Japan) is expected to raise rates.
- RBA is expected to cut rates if statistics match, or is lower than forecasts.
Combined, this creates an environment where investors may be taking their money out of AUD to seek better currencies to invest in.

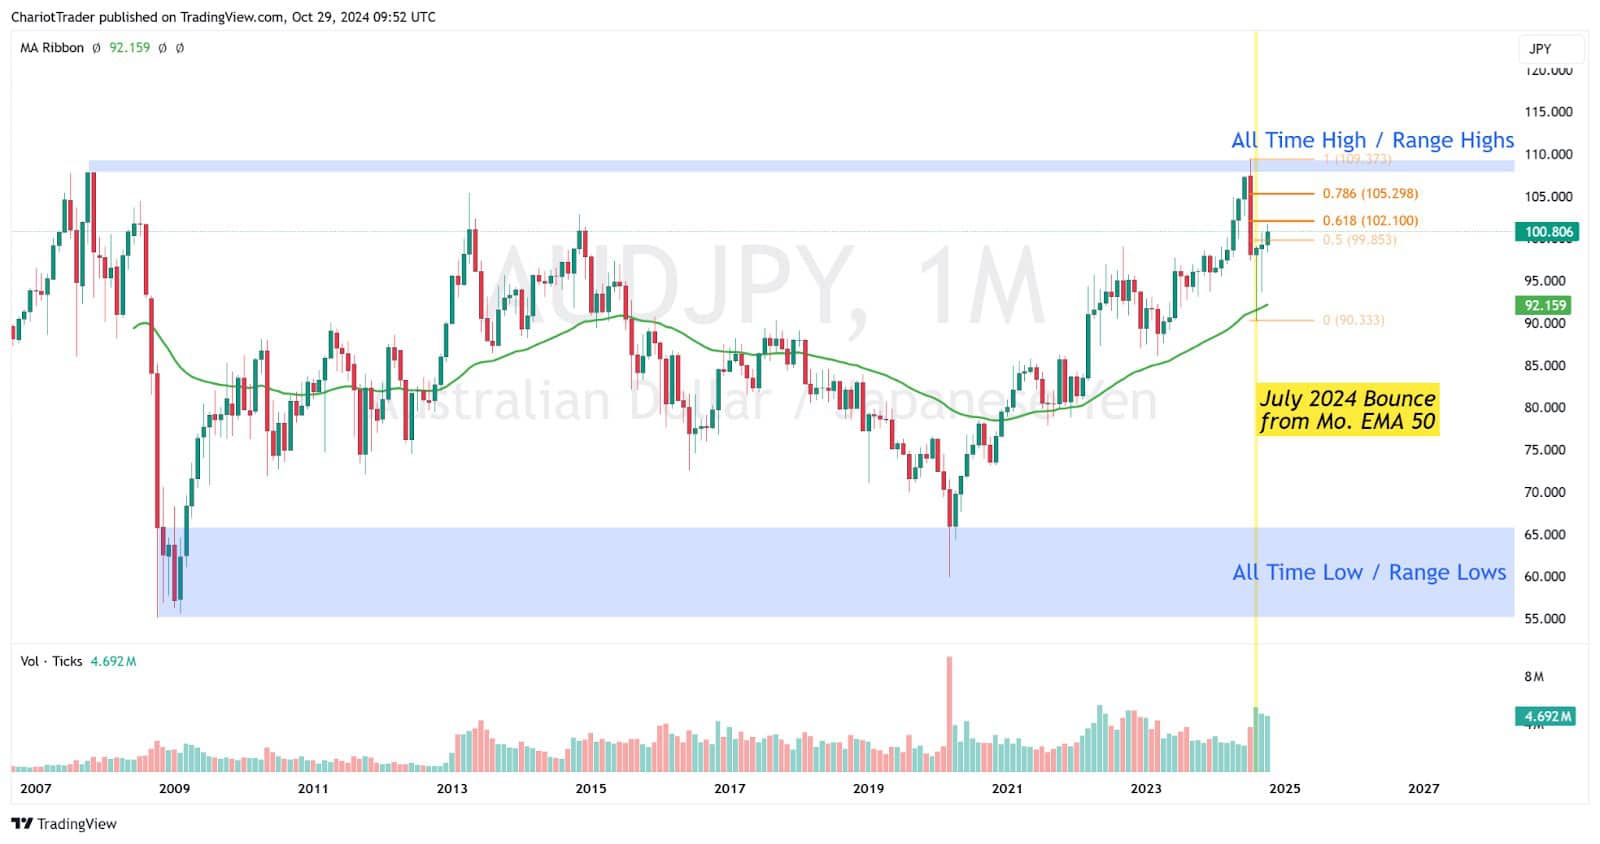
On the technical side, AUD/JPY is actually bullish looking. It has reclaimed the Monthly EMA 50 in December 2020, and held prices above the EMA for 4 years straight. The price also bounced off the EMA in July with huge volume, indicating the uptrend is powerful and continuation is likely.
However, the asset has also tapped into the 2007 highs (¥107.818) in June and experienced a powerful rejection candle in June of 2024. Seeing that we are technically at the top of the range, a downtrend beginning from the top of the range could technically occur here.
Using a Fibonacci retracement tool, we can find key levels to watch for a rejection – namely the 61.8% and 78.6% Fibonacci retracement levels at ¥102.100 and ¥105.298 respectively.
Closing Thoughts
With CPI data on the horizon, the Australian dollar faces significant pressure, especially against stronger currencies like the USD, NZD, and JPY, where central banks are either maintaining or increasing rates. If the CPI numbers meet or fall below forecasts, this would likely reinforce the RBA’s cautious stance, potentially leading to rate cuts and further weakening the AUD in forex markets.
Technical analysis adds weight to this bearish outlook, as major resistance and support levels are already in play across AUD pairs. AUD/USD is navigating critical EMAs and trendlines, while AUD/NZD and AUD/JPY are contending with established resistance zones that, combined with softer fundamentals, may prompt downward moves.
Investors will be closely monitoring the CPI release and RBA’s subsequent approach, as any deviation from expected data could either confirm or pivot current trends.
You may also be interested in:


