


- Elliott Wave
- July 3, 2024
- 2 min read
USDCHF Elliott Wave: Meets Resistance and Falters
Executive Summary
- USDCHF greets resistance trend line formed from May 1
- Today’s high could be the end of wave 2 and the start to wave 3
- The pattern is bearish to .8670 while holding below .9050
What Elliott Wave Pattern Has Been in Development?
On Wednesday, July 3, USDCHF created a daily range of 65 pips. Nothing extraordinary, per se, as there have been a couple of candles in the month of June with similar size or proportions to Wednesday’s candle.
What makes Wednesday’s candle important is that it likely kicks off a bearish third wave, when analyzing USDCHF using Elliott Wave Theory.
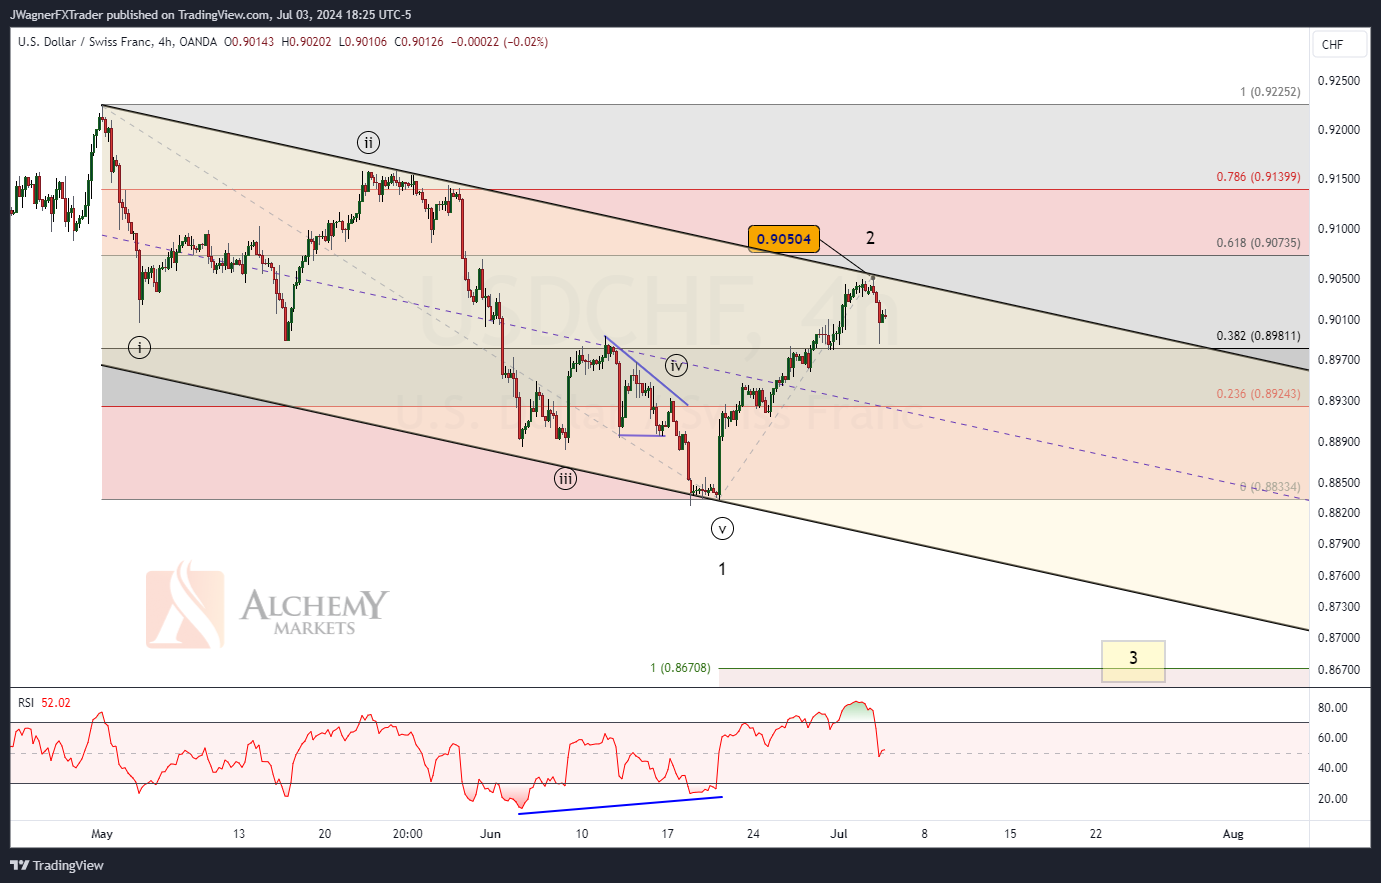
We can count a complete bearish impulse from May 1 to June 19 labeled ((i))-((ii))-((iii))-((iv))-((v)). Heading down into the low we can spot bullish RSI divergence. This is a common trait among the fifth wave of an impulse sequence. This impulse was then corrected by a brief rally carrying up to today’s high.
Notice how USDCHF rallied up to meet a downward sloping resistance trend line. This trend line suggests the trend is still pointed downward.
As a result, today’s decline may kick off a resumption of the old downtrend in a third wave.
The Current Elliott Wave Count
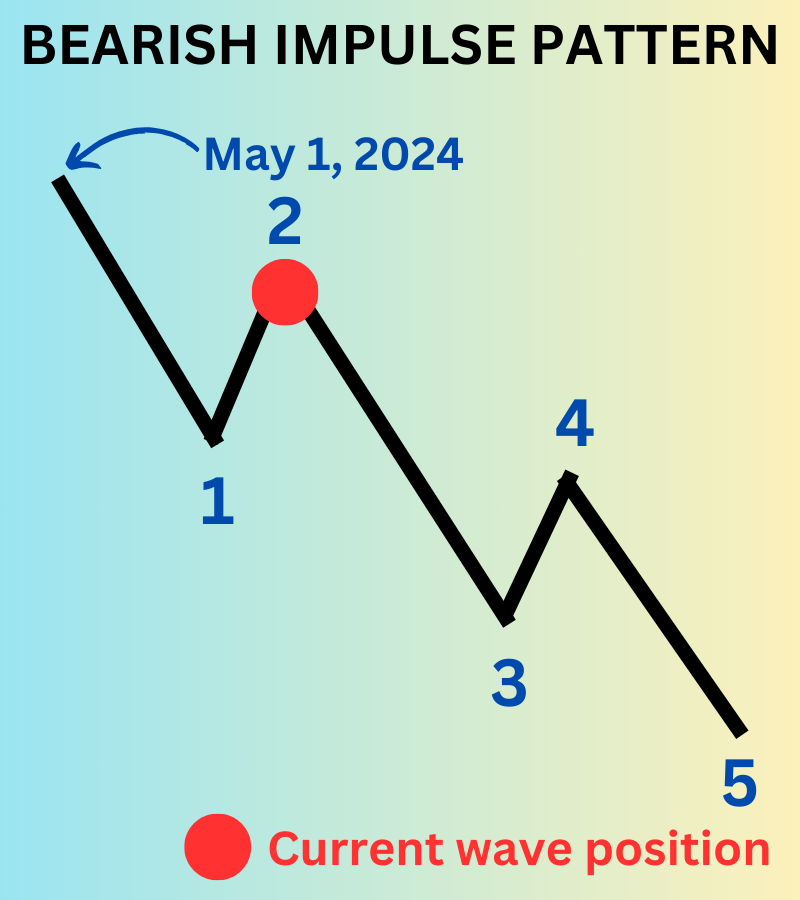
Therefore, it appears today begins wave 3 of a larger 5-wave bearish impulse sequence.
Based on the length of wave 1, we can establish estimates for wave 3 using the Fibonacci extension tool.
Wave 3 oftentimes reaches the 1.000 or the 1.618 level. As a result, it is quite possible for this wave 3 to stretch down to .8670 and possibly .8442.
Once wave 3 terminates, then a mild rally in wave 4 would be followed by another decline in wave 5.
Bottom Line
USDCHF appears poised to decline to .8670 and possibly .8442.
If USDCHF rallies above .9050, then we will need to reconsider the wave count as the price would also be breaking above the downward sloping price channel.
You Might Also Be Interested In: EURUSD Bullish Turn at Support


