


- Elliott Wave
- August 22, 2024
- 3 min read
From Peak to Plunge: USD/JPY Stares Down the Cliff (Elliott Wave)
Executive Summary:
- USDJPY reached an important top in July 2024
- USDJPY may be in the beginning stages of a large decline to 130
- Below 157 keeps the bearish forecast on centre stage
Long-Term Elliott Wave Pattern on USDJPY
It’s been a heck of a trend for USDJPY over the past two years as it rallied from the January 2023 low of 127.21 to the July 2024 high of 161.95.
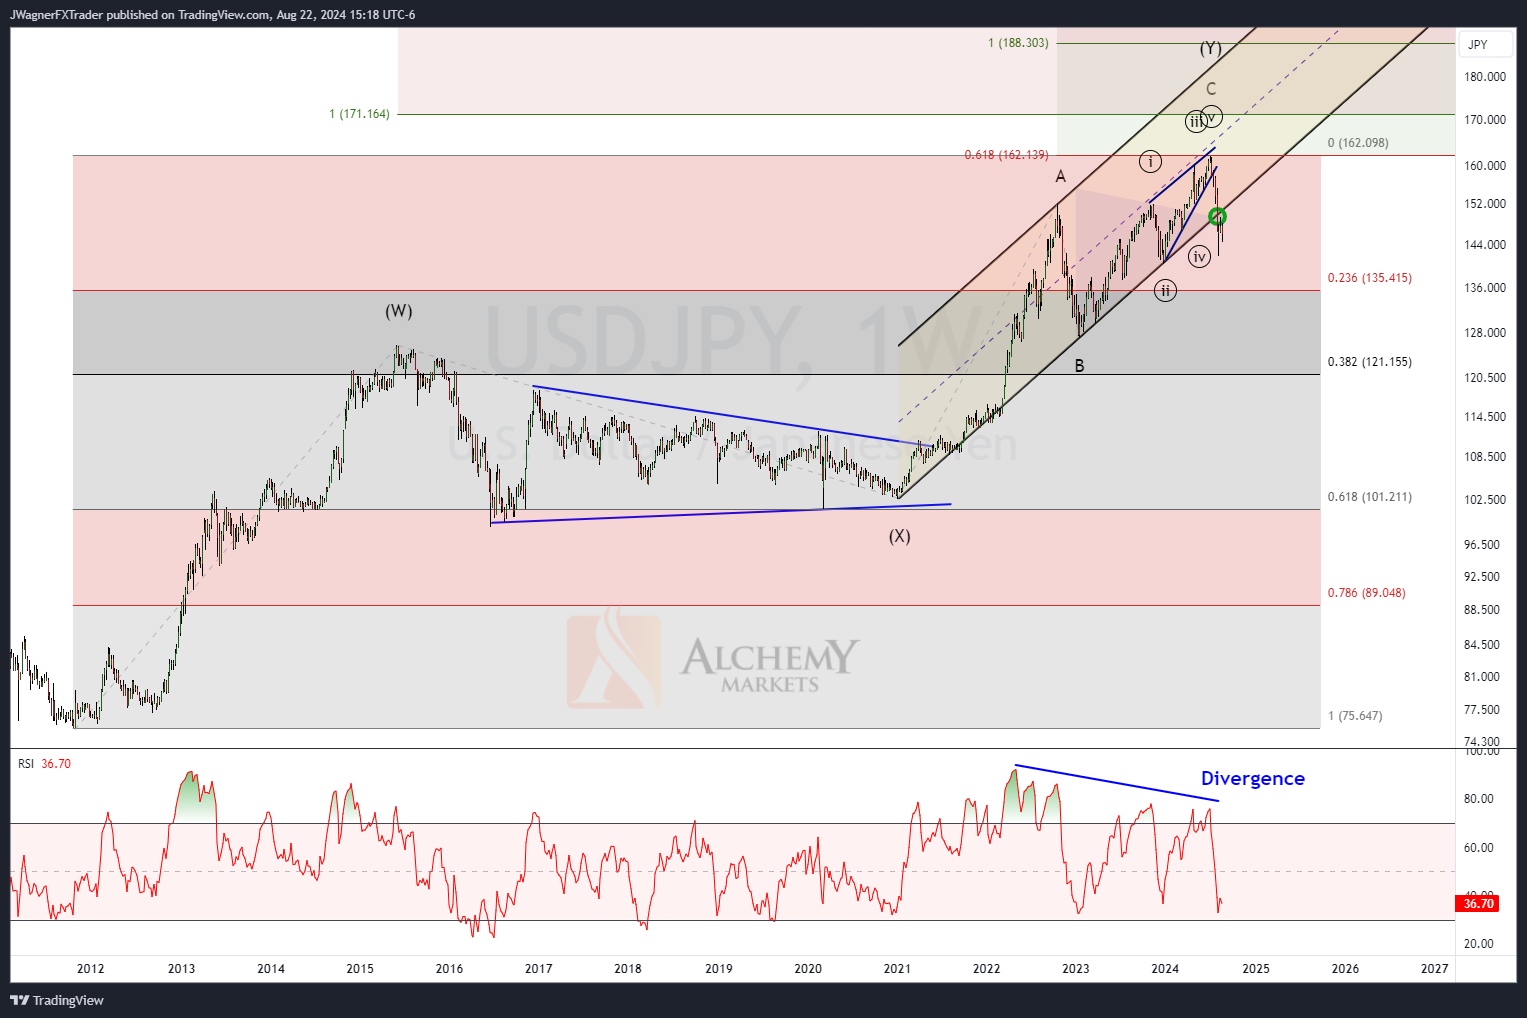
The long-term Elliott wave charts suggest that the July 2024 high is an important top. We can count a completed 13-year Elliott wave pattern from the 2011 to the July 2024 high.
The completed pattern would be a double zigzag labelled (W)-(X)-(Y). Within wave (Y), there is an A-B-C zigzag where wave C is .61.8% the length of wave A. This is a common wave relationship between those parallel waves.
Wave C appears to have completed an ending diagonal pattern. USDJPY has already broken the upward sloping parallel channel.
Therefore, the Elliott wave pattern suggests USDJPY is at the beginning of a large decline towards the major Fibonacci retracement levels (23.6%, 38.2% and possibly lower).
USDJPY 4 Hour Chart
When we look at the intraday chart for USDJPY, there are a couple of wave models we are watching closely.
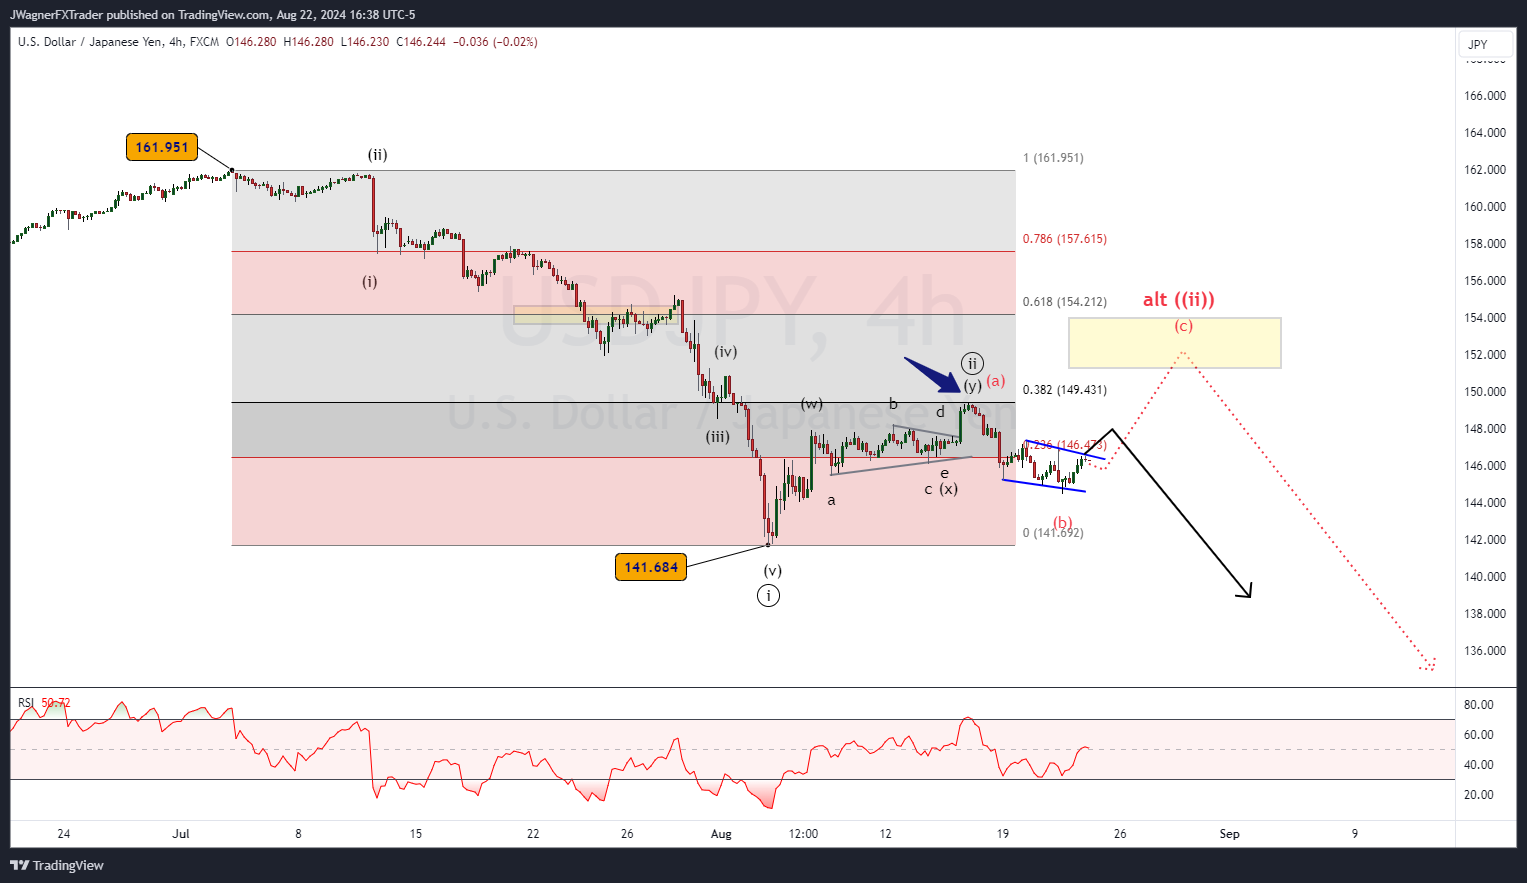
The first Elliott wave model counts the July decline as wave ((i)) and the current bounce as wave ((ii)). The minimum waves are in place for wave ((ii)) and it tagged the 38% retracement of the July decline.
This wave count would suggest USDJPY is in the beginning stages of a wave ((iii)) decline…a swift trend lower.
However, the price action over the past couple of days have become sloppy. Due to the brief rally in both price and time, the second Elliott wave model we are following (red labels) is that last week’s high was simply wave (a) of a larger (a)-(b)-(c) rally. This means wave (b) is over or nearly over and wave (c) would carry higher up to 149.50-154 to complete wave ((ii)).
Under both of these models, wave ((iii)) downward has either begun or will begin in the next few weeks. It’s almost as if USDJPY has stepped to the edge of a cliff and is peering over the edge trying to decide whether to jump or not.
A huge driver of this decline could be blamed on an aggressive rate cut cycle, or perceived aggressive cut cycle by the Fed. The USD was used in a carry trade against the JPY. Though the large differential still exists between USD and JPY, if the perception that the interest rate differential will shrink fast, then the USDJPY may drive quickly lower.
Bottom Line
If wave ((iii)) hasn’t started already, USDJPY may see a large decline in the coming weeks that carries down to 130 and possibly lower levels.
You might be interested in:
Crude Oil Elliott Wave: A Brief High Before It Takes a Spill


