


- Elliott Wave
- March 26, 2025
- 2 min read
S&P 500 Elliott Wave: Correction Over, For Now
Executive Summary
- Trend Bias: Tentatively bullish, as wave ii appears complete near key Fibonacci support.
- Key Support: 5,504 – the (c) wave low and just above the 0.618 retracement at 5,447.
- Next Upside Target: A break above 5,793 (0.236 retracement) opens the door to 5,900 and possibly new highs.
Current Elliott Wave Analysis
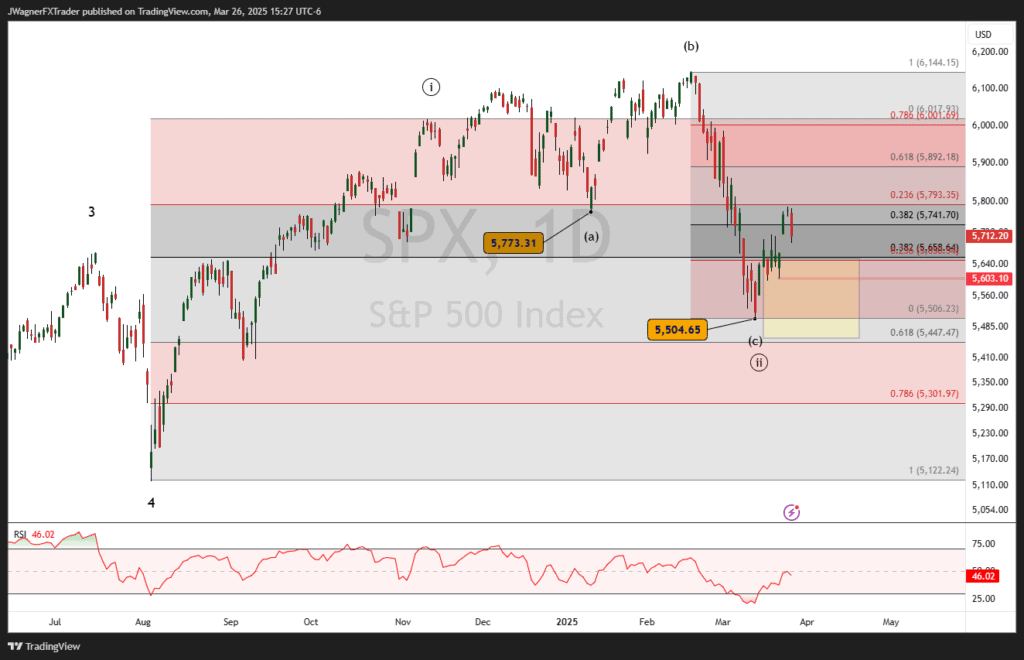
The S&P 500 appears to have completed a corrective wave ((ii)) of a larger bullish impulse that began at the August 2024 low. Within this Elliott wave impulse, wave ((i)) peaked near 6,017, and the subsequent ABC correction shows an expanded flat (3-3-5) pattern unfolding:
- Wave (a) declined to 5,773
- Wave (b) rallied to 6,147 on February 19
- Wave (c) concluded at 5,504, forming the low of wave ((ii))
This entire structure finds support above the 0.618 Fibonacci retracement (5,447) of wave ((i)), which is a typical depth for a second wave correction. The market has since bounced from the 5,504 low and could be in the beginning stages of wave ((iii)). A print below 5,504 will force us to consider the alternate wave count.
Alternate Wave Count
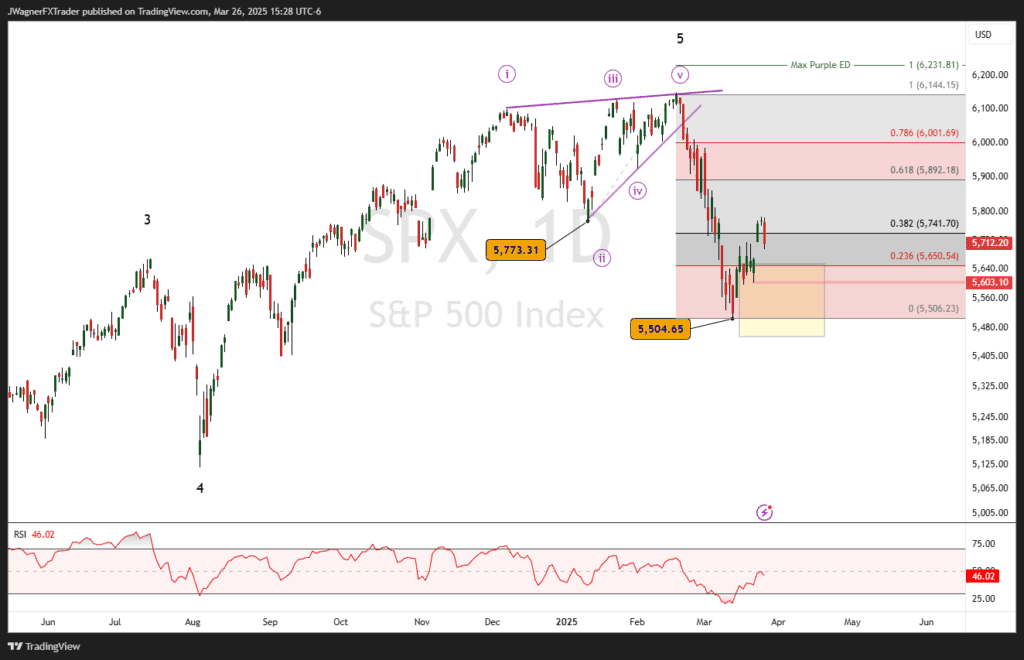
There is an alternate wave count that we are following where minor wave 5 terminated at the February 19 high as an ending diagonal pattern. This implies a fast and swift retracement back down to the wave 4 low at 5,122.
Under this alternate scenario, SP500 could rally higher, possibly reaching 5,900. This could be a countertrend bounce within a larger downtrend.
If SP500 falls below the March 21 low at 5,603, then we’ll need to consider elevating the alternate wave count to primary status.
Bottom Line
If wave ii is indeed complete at 5,504, we are now at the early stages of wave iii, which is typically the strongest and longest within an impulse structure. The key pivot for this bullish outlook is 5,504—holding above keeps the setup valid.
An inability to break higher may suggest a larger and more important top is in place. A trend below 5,504 will force us to consider the alternate wave count, and a completed ending diagonal pattern at the February 19 high.
This is a very bearish pattern and forecasts a swift retracement down to 5,122.
You might also be interested in:


