


- Elliott Wave
- June 4, 2025
- 1 min read
Nasdaq Eyeing All-Time Highs [Elliott Wave]
Executive Summary
- Trend Bias: Bullish wave (iii) nearing its end.
- Immediate Target: 22,000 – 22,600 based on 1.618 extension of wave (i).
- Key Level: Wave (iv) decline likely reaches 20,600 and the bullish structure is preserved.
Current Elliott Wave Analysis
The 4-hour Nasdaq 100 (NDX) chart reveals an Elliott wave impulse pattern nearing the end of wave (iii) of ((iii)).
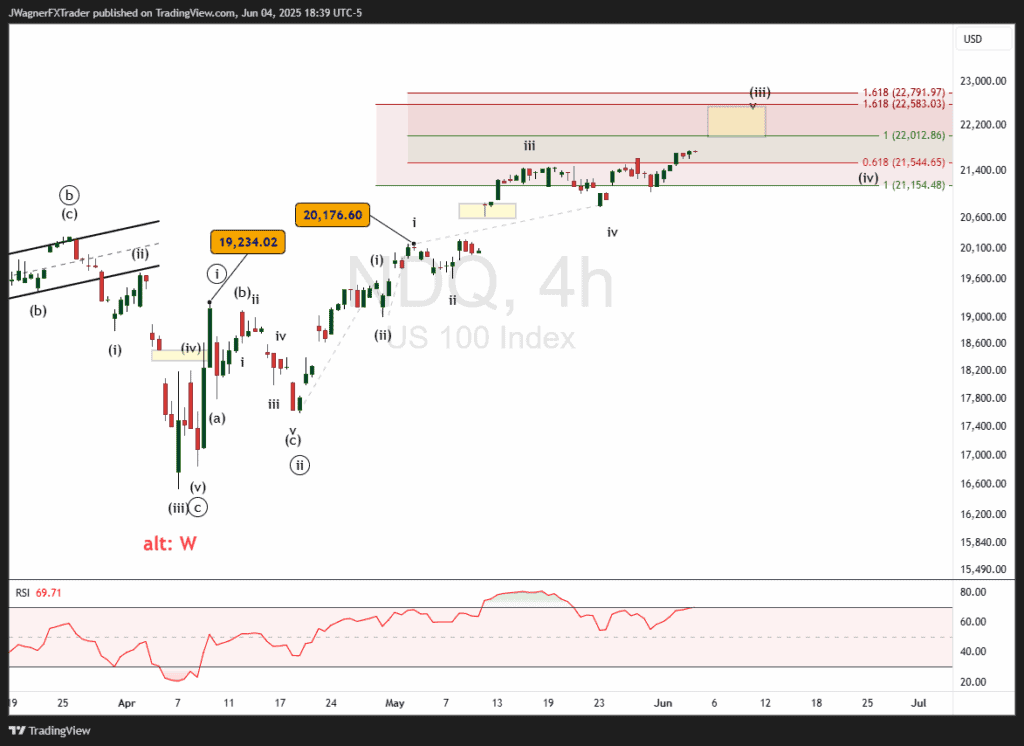
We are estimating the target for this third wave near 22,000 – 22,600. This same price zone happens to be the all-time high for NDX too.
A lot of resistance is likely to be witnessed.
If wave (iii) terminates in that price zone, then a decline back to 20,600 – 21,000 would be considered normal.
Therefore, we are anticipating some turbulent price action as the previous all-time highs are tested. However, after a brief retracement lower in wave (iv) of ((iii)), we’d expect wave (v) to gather itself and rally to retest those highs again.
RSI is displaying some divergence with price making new recent highs while the RSI oscillator lags behind.
You might be interested in…


