
- Elliott Wave
- October 7, 2025
- 2 min read
Nasdaq Elliott Wave: Diverging RSI
Executive Summary
- Trend Bias: Slowing bullish momentum, bearish reversal nearby.
- Key Support Level: 21,550 – 22,840.
- Lower levels are possible depending on the structure of the decline, if it develops.
Current Elliott Wave Analysis
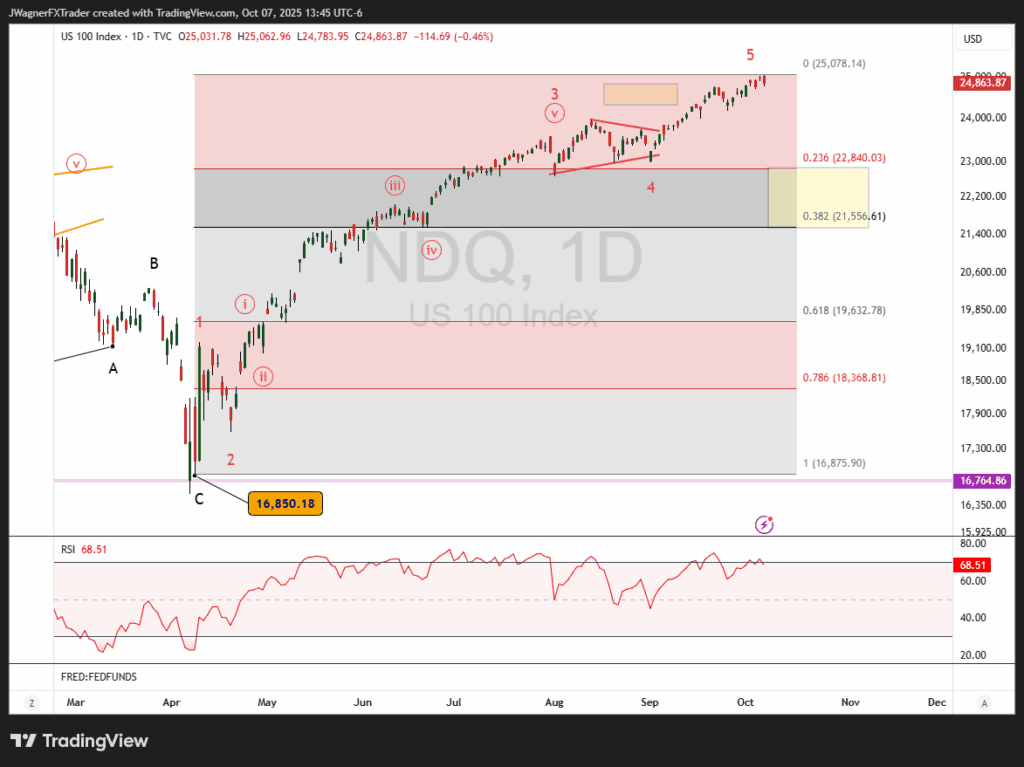
Our Elliott wave analysis of the Nasdaq 100 (NDX) chart hints the rally that began in April is nearing its end.
We can count a 5-wave Elliott wave impulse pattern from the low in April to today’s high. Wave 2 of the impulse pattern corrected -8% as a zigzag. Wave 4 corrected a shallow -4%, but in a symmetrical triangle pattern.
Therefore, we can count the minimum waves in place for a bearish reversal.
Helping feed the forecast is RSI divergence appearing between waves 5 and 3. This is common behavior for RSI to divergence with price when comparing the third and fifth wave extremes.
If NDX does turn lower, then the first level of support sits between 21,550 – 22,840. Oftentimes, after a completed impulse, price retraces the entire 5th wave and pushes back to the 4th wave extreme. Flanking the price range above is the wave 4 low and another previous fourth wave, wave ((iv)).
The structure of the decline will give us insight as to the pattern being produced and depth.
The minimum bullish waves are in place, but it is still possible for NDX to continue marching higher. However, the RSI divergence does suggest the momentum is slowing to the upside and that a decline may be looming nearby.
Bottom Line
The divergence on RSI hints that momentum is slowing and a bearish reversal may appear. In such a situation, a trend lower to 21,550-22,840 is a first level of support. Lower levels are possible depending on the structure of the decline.