- Elliott Wave
- July 29, 2025
- 2 min read
Gold Struggling to Break Through: XAUUSD Elliott Wave
Executive Summary
- Trend Bias: Gold (XAUUSD) is in the middle of a triangle pattern, currently in wave ((c)).
- Key Levels: Support zones to watch include $3,245 and $3,120.
- Once this wave terminates to the downside, then we anticipate a small rebound in wave ((d)) to hold below $3,450.
Current Elliott Wave Analysis
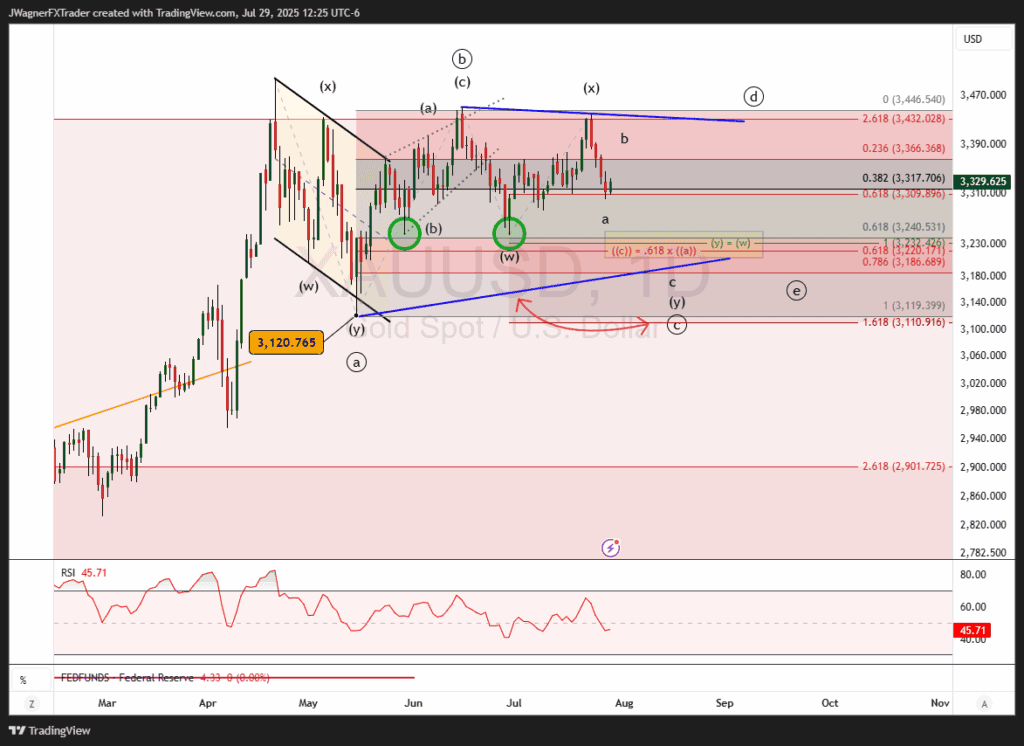
Gold’s price action suggests it is carving an Elliott wave triangle pattern. Gold appears to be in the middle of the symmetrical triangle, in wave ((c)) of the 5-wave pattern.
Wave ((c)) is carving as a double zigzag with the current wave lower labelled as ‘a’ of the second zigzag (y).
This wave lower appears incomplete and we forecast it’ll likely bottom $3,120 – 3,245.
There are previous swing lows near $3,245 (green circles). Additionally, wave ((c)) is equal to .618 times wave ((a)) at $3,220, a common wave relationship within a triangle. Lastly, wave (y) is the 100% Fibonacci extension of wave (w) at $3,232.
As you can see, there are several wave relationships suggesting strong support near $3,220-3,245.
For the larger triangle pattern to remain valid, this wave ((c)) decline would need to hold above $3,120.
Bottom Line
Gold appears to be declining in the middle of a large triangle pattern. The current decline is labeled wave (c of (y) of ((c)) and likely reaches $3,120 – $3,245.
Once this decline is complete, then a shallow rally in wave ((d)) of the triangle likely holds below $3,450.