


- Elliott Wave
- May 22, 2024
- 3 min read
Gold Elliott Wave: Near Term Rally Completed
Executive Summary
- Gold’s rally in May has taken shape of a corrective pattern
- Near-term top may be in place in wave (b) of a flat pattern
- Bearish targets include $2343 and $2277
This Week’s High Completes in 7-Waves
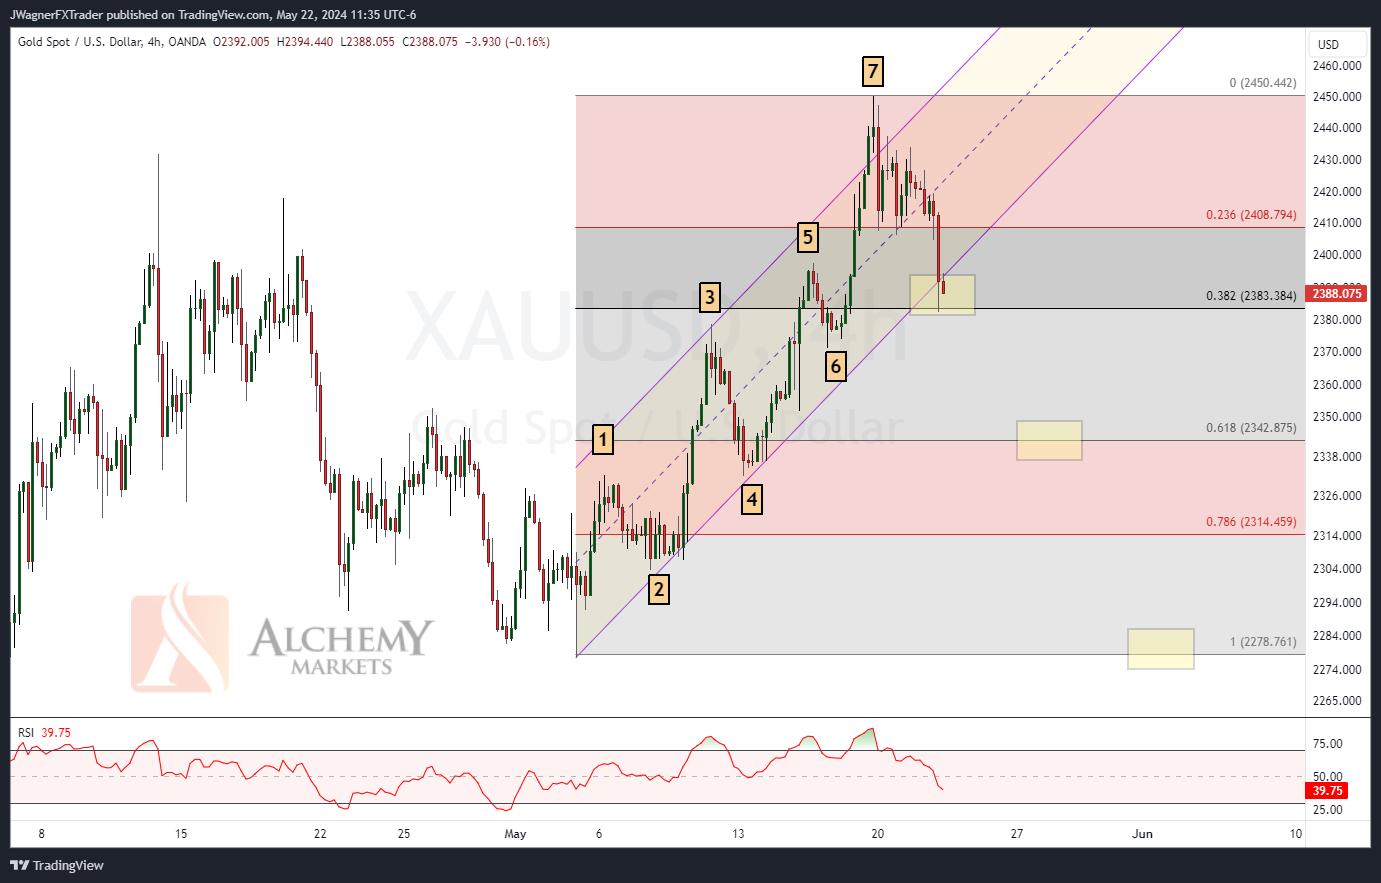
The rally from May 3 has taken shape in 7-waves. This provides a big clue that a medium-term top may be trying to form. If so, then a deep and possibly a full retracement of the May 3 rally could be underway.
Right now, gold prices have held at the 38.2% retracement level of the May 3 rally. Parallel channel support is also crossing near this zone.
If this price zone of $2383 cannot hold gold’s price up, then a deeper correction likely unfolds down to $2342 and possibly down to $2278.
Current Gold Elliott Wave Count
The current Elliott wave count for gold is wave ((c)) of 2/B. If this forecast holds, then gold is declining in the final wave of an ((a))-((b))-((c)) flat pattern.
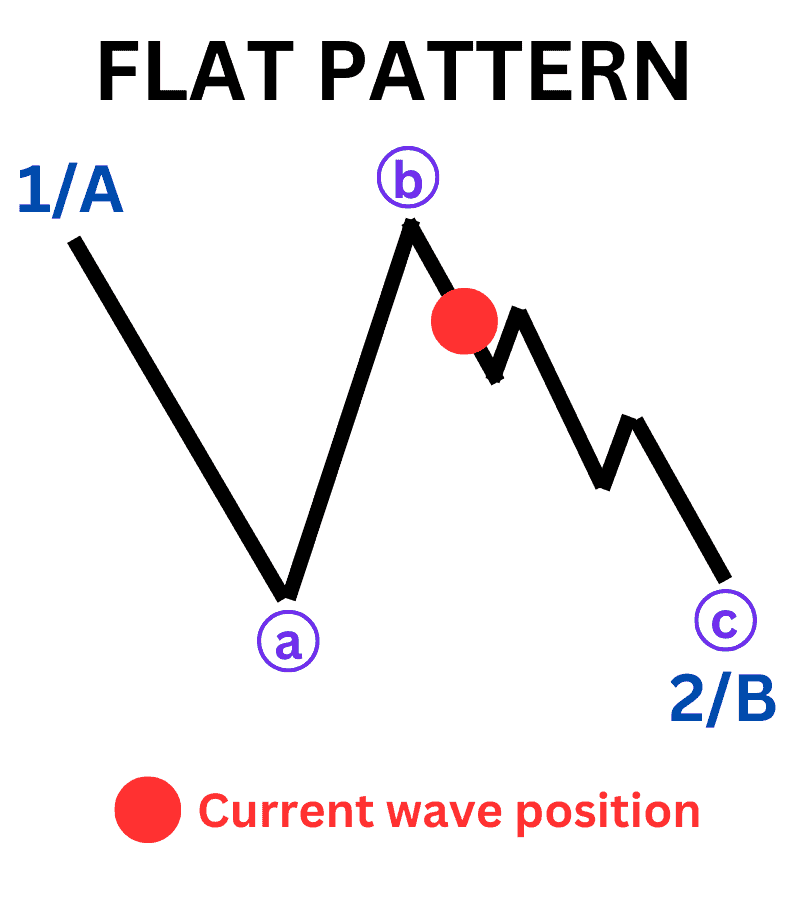
This week’s high of $2450 is viewed as the wave ((b)) top. Therefore, the current decline in prices are viewed as wave ((c)). Flat patterns have a distinct shape where waves ((a)) and ((b)) unfold in corrective waves such as zigzags, flats, double combos and triple combos. Though waves ((a)) and ((b)) are corrective, it is common for ((b)) to differentiate itself from ((a)) by carving with a different tone of complexity.
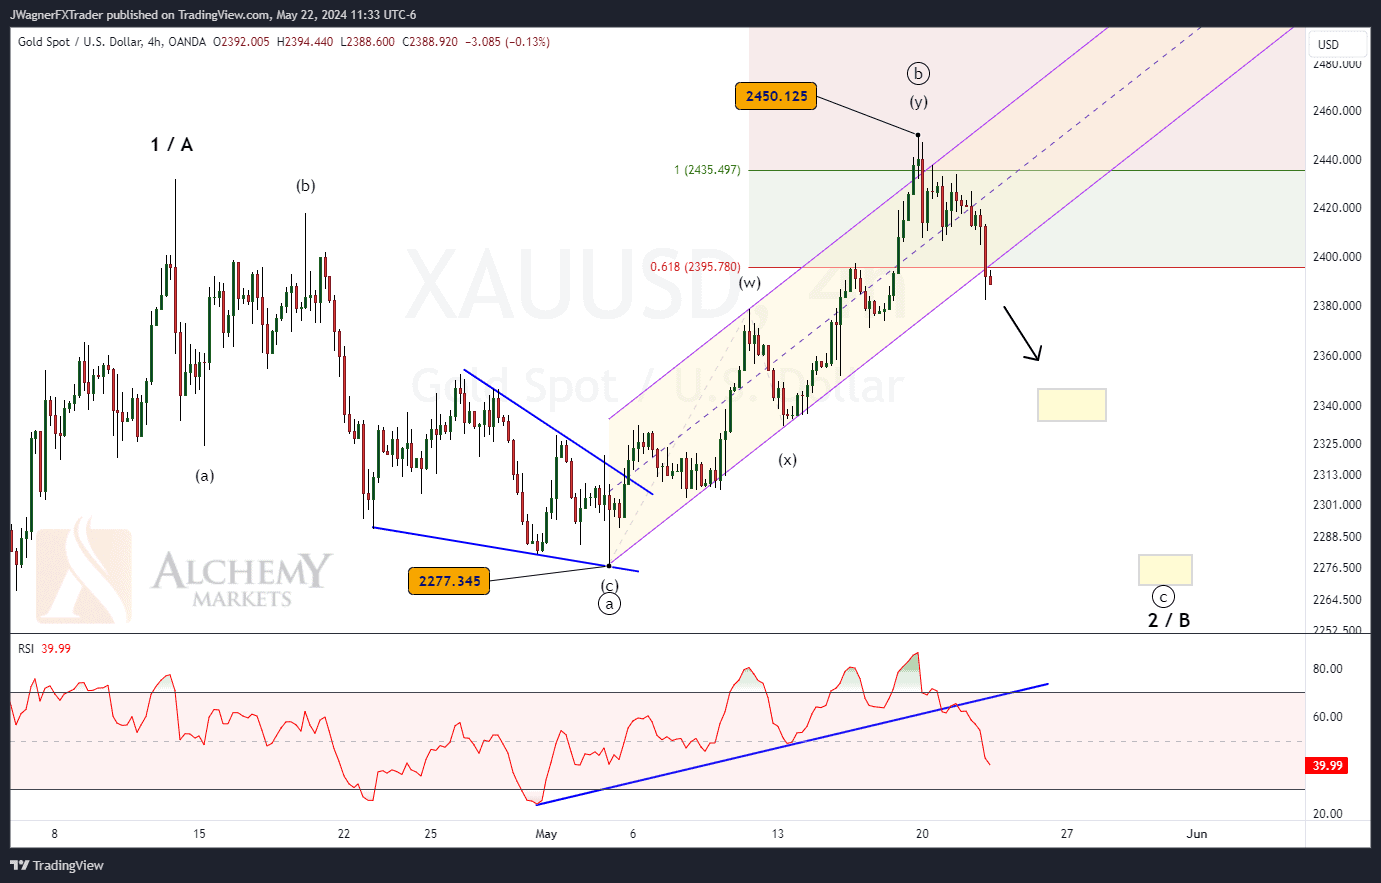
In this case for gold, wave ((a)) was a zigzag pattern while wave ((b)) was a double zigzag.
With prices trying to push outside of the parallel channel, the market is sending signals that the corrective rally has changed and that wave ((c)) may be working lower. We receive additional confirmation with the RSI breaking down below its support trend line.
The ((c)) wave of a flat pattern will subdivide as an ending diagonal or impulse pattern. Under both scenarios, it will be a 5-wave decline that could reach $2342 or $2278.
Bottom Line
Gold appears to have carved a medium term top at $2450. If so, then a decline to $2342 and possibly $2378 is underway.
Count the waves as they unfold and as we approach the fifth wave, we’ll be on the look out for a significant low to form.
If gold rallies above $2434, then we’ll need to reassess the wave count.


