


Written by:


- Chart of the Day
- September 20, 2024
- 2 min read
Iceberg Ahead: WTI Crude (USOIL) Veering Into Resistance
WTI Crude oil (USOIL) has seen bearish price action for the past 3 months, consistently forming lower highs on its pullbacks.
As the price trails up again, you have to wonder if we are headed for another collision course. Or will the USOIL not behave like the titanic, and safely cruise into higher highs?
Bearish Scenario: USOIL Gets Rejected, but Could Form a “W”
As of now, before the NY Market Open, the USOIL price has seen a slight relief across 7 trading days. Despite this, the asset is technically still in a downtrend.
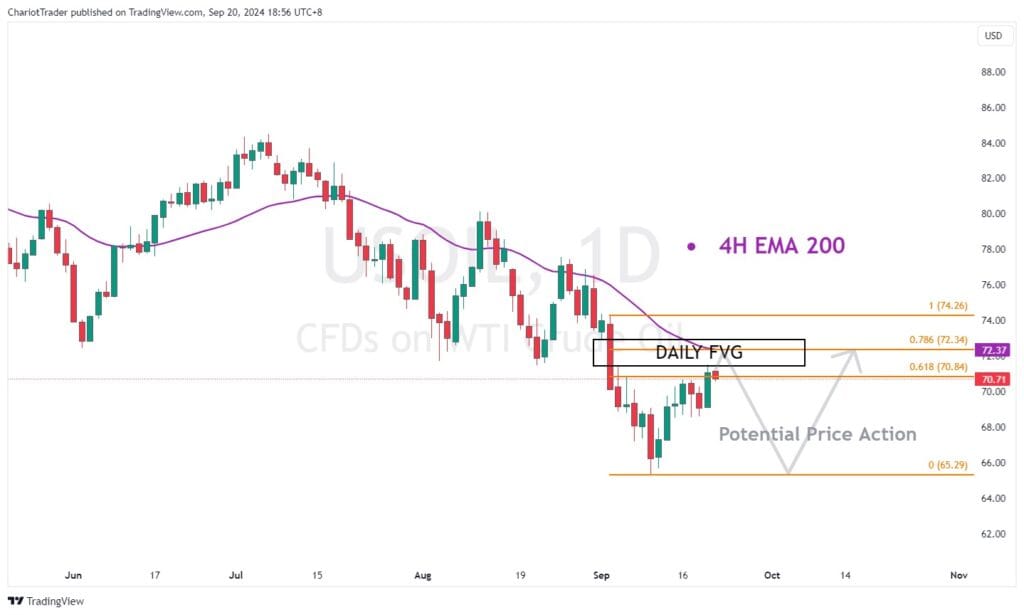
Nevertheless, USOIL is grinding up towards an overhead “iceberg”, which could offer some temporary resistance. This “iceberg” is a combination of the 4-Hour EMA 200, a daily fair value gap, and the 0.768 Fibonacci retracement level.
Furthermore, it’s also a zone that previously acted as support, which would now be turned resistance, from approximately $71.45 to $72.93.
IF USOIL gets rejected here, we could see prices decline back to previous lows at approximately $65.29 – which could potentially offer a bounce. In such a scenario, a “W” double bottom pattern may emerge on USOIL, but that remains to be seen in the coming weeks.
The alternative bounce zone would be at $69.07, which is a value area low from an Anchored Volume Profile drawn from December 2023. This level would be visible in the chart below.
Bullish Breakout Scenario Could Take USOIL Back to $80.00
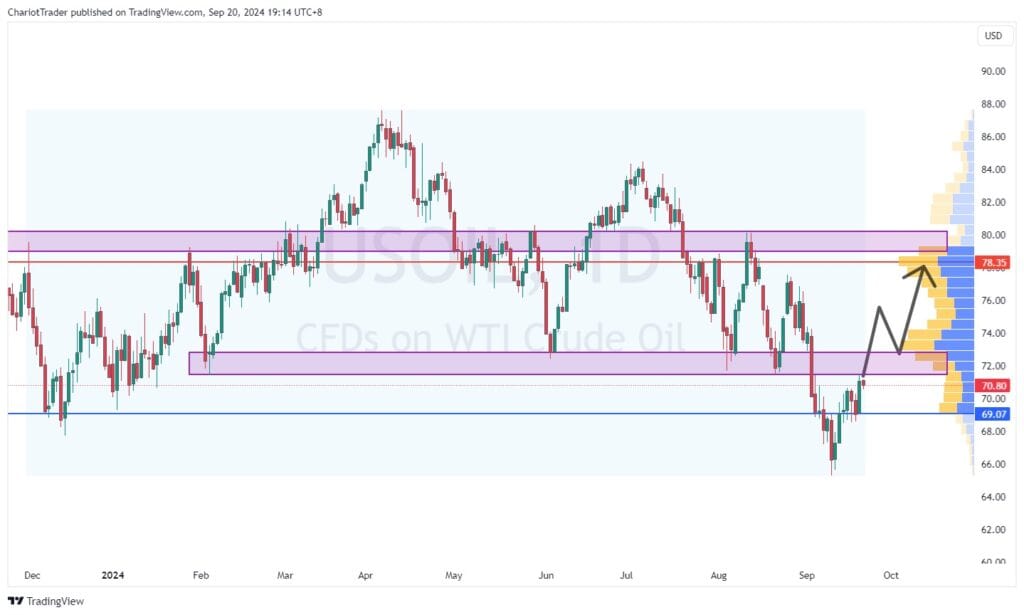
Using the anchored volume profile tool, we can find the key areas of interest from traders since December last year. With this, we’re able to discover several interesting levels to watch.
The first being the value area low (VAL) at $69.07. In the scenario where price does not get rejected back down to approx. $65, the VAL would be the key area to watch.
However, the other bullish scenario would be a breakout, and support flip of $71.45 to $72.93.
From there, USOIL could make a run for its previous high, its point of control, or even the significant resistance zone at $80.00 dollars.
| Support Levels to Watch on USOIL: • Value Area Low: Approx. $69.07 • Previous Lows: Approx. $65.29 |
| Resistance Levels to Watch on USOIL: • Collection of resistances: Approx. $71.45 to $72.93 • Previous High: Approx. $77.48 • Point of Control (Area with Biggest Trading Volume): Approx. $78.35 • Significant Resistance in 2024: Approx. $79.00 – $80.00 |
You may also be interested in:
Is it a Bull Trap: S&P 500 Retesting All-Time Highs


