


Written by:


- Chart of the Day
- September 6, 2024
- 2 min read
Break or Bounce: USDSGD Dancing at Weekly Range Lows

USD/SGD has been in a tight range from 2023 to 2024, consolidating between $1.32 to $1.36 SGD. However, the price of USD/SGD has seen a consistent decline for the past 9 weeks – eventually leading the asset to a key level at $1.30.
This zone could potentially provide a bounce, but in the event of a breakdown, we may see prices as low as $1.20 on USD/SGD.
Let’s break it down.
Technical Analysis of USDSGD Weekly Chart (September 6th, 2024)
The price currently sits at $1.29800, just below the key 618 Fibonacci retracement support level at $1.30080. A weekly close below this level could be bearish, however, since the candle close is barely visible, this could merely be a fakeout.
This fib level aligns with a key support zone dating back to 2011, which also acted as support in 2018.
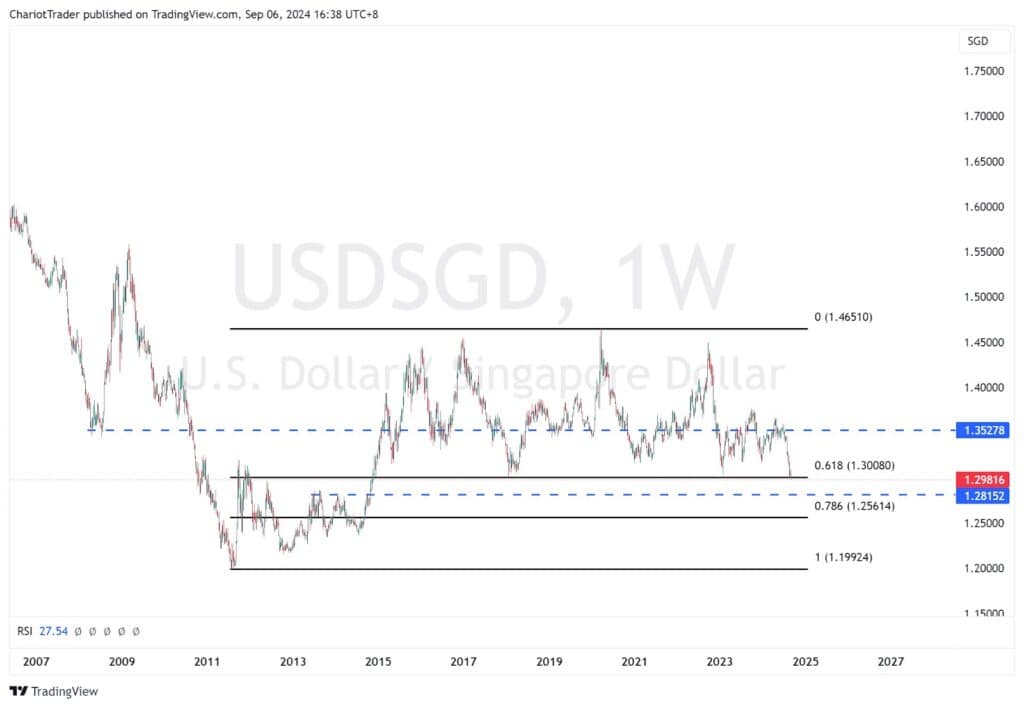
Traders might expect a potential bounce from this price zone, targeting the $1.35278 level, which serves as key resistance and is near a point of control traced from September 2011.
Zooming in further, we also see the potential for USD/SGD to form a small, albeit existent bullish RSI divergence, especially if the week does close bearish. Additionally, the weekly RSI is oversold, lending more chops to the idea of an imminent reversal.
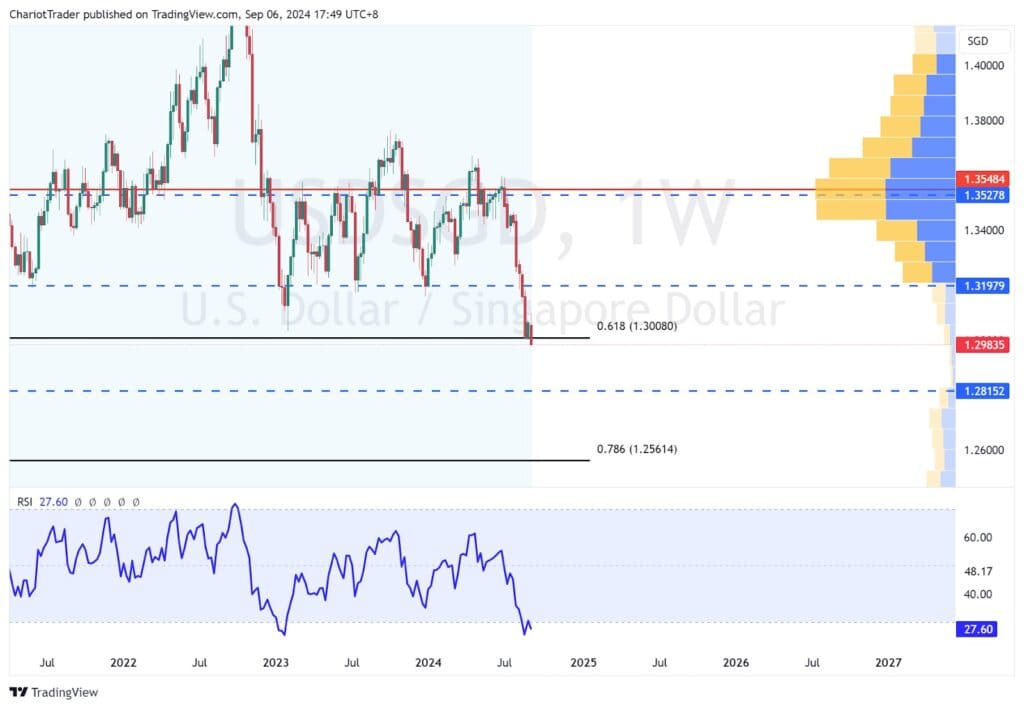
In the event of a further drop, the price could find some refuge at approximately $1.28152, an area that previously acted as resistance from 2013 – 2014. A further decline than that could take USD/SGD to the 78.6% Fibonacci retracement at $1.25614, or even lower towards approximately $1.20.
| Support Levels to Watch on USDSGD • Current Support Zone: $1.30 – Aligns with 0.618 Fib Retracement • Previous Highs (Now flipped support): Approx $1.28152 • 0.768 Fib Retracement: Approx $1.25614 • All-time lows: Approx $1.20 |
| Resistance Levels to Watch on USDSGD • Minor weekly support/resistance: Approx $1.31979 • Point of Control (decade old): Approx $1.35850 • 2023 Highs: $1.37640 |
You may also be interested in:
US Oil – Sell-off Due to Libyan Supply
Flash Crash Recovery: Will the S&P 500 Bounce at Market Gap?


