


Written by:

- Chart of the Day
- February 4, 2025
- 2 min read
Trade War Paused: Are we risk-on again? S&P 500 Analysis
From talks of tariffs to the battle of interest rate ideology from US president Trump versus the Federal Reserve, Q1 of 2025 so far has been a heck of a roller coaster ride.
The most recent development? US President Donald Trump has agreed to put a pause on 25% tariffs on imports from Mexico and Canada, so long as both countries strengthen their border security and combat drug trafficking into the United States.
On Monday (Feb 3rd), the S&P 500 experienced a decline of 1.50% in a single day, after Donald Trump’s tariff announcements on Saturday and Canada’s retaliatory tariffs over the weekend. Now that Canadian Prime Minister, Justin Trudeau, has walked back on his tariffs on American goods, and Donald Trump has issued a pause on tariffs—are the markets now back to a risk-on mentality?
The answer is that it’s too early to tell. Given the recent volatile developments in the global political sphere, it’s more likely that major financial institutions are in a “Wait-and-see” mode. However, we have an easier way to understand what market intentions are: Technical Analysis. So let’s get into analysing the S&P 500’s daily chart.
S&P 500 Daily Chart Analysis
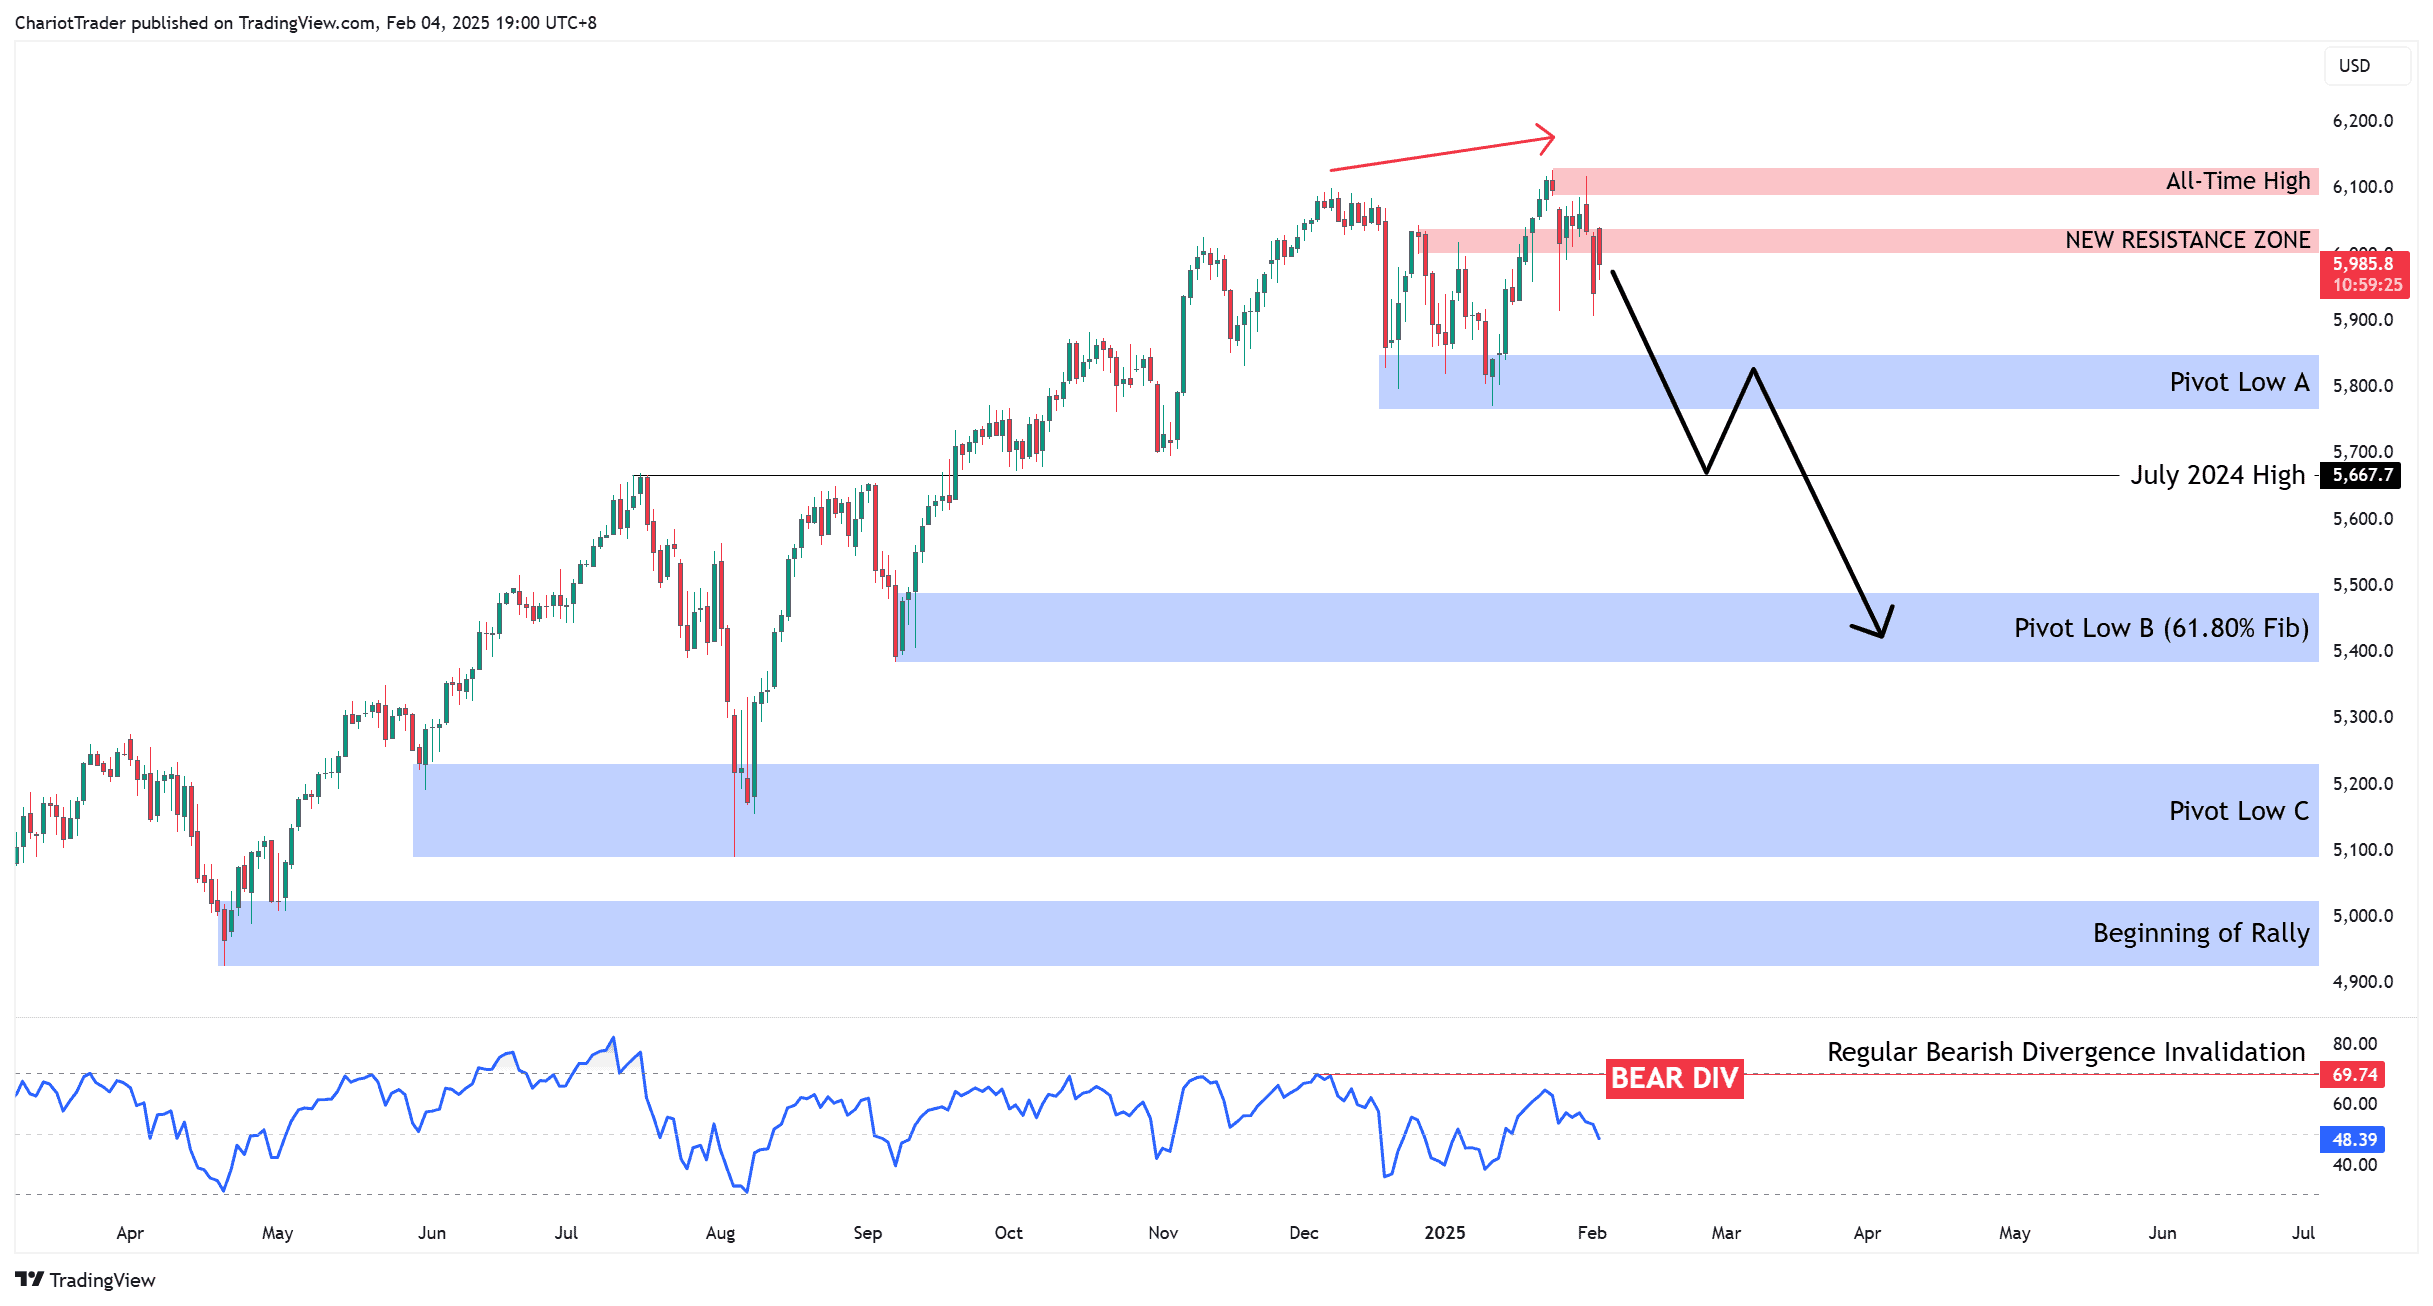
While the overall trend is bullish, the S&P 500 is showing some slightly bearish signs in the short term.
This includes a daily bearish divergence, and a new resistance zone between $6,000 – $6,040, where the S&P 500 is currently rejecting from.
- If price continues to decline, we could see a test into the Pivot Low A price zone ($5766 – $5850).
- A breakdown here would confirm the daily bearish divergence, which could send prices lower towards the July 2024 High ($5667), and towards the Pivot Low B’s price zone ($5385 – $5490), which aligns with a bullish 61.80% Fib Retracement.
- This support area has already experienced 3 prior tests, making a weaker support. So bullish investors and traders definitely should keep a close eye on $5766 – $5850.
Key Takeaway: If the S&P 500 holds above Pivot Low A, it could regain bullish momentum and push to new highs. However, an ABC correction also seems likely, as a pullback would be a healthy reset after 2024’s strong rally.
You may also be interested in:


