


Written by:


- Chart of the Day
- September 5, 2024
- 3 min read
Flash Crash Recovery: Will the S&P 500 Bounce at Market Gap?
As the S&P 500 approaches its all-time highs at $5,669.67, a flash crash on Tuesday may have come as a surprise to many. This price action only continued on the following day, leading to a drop of 2.61%.
Traders and investors are left wondering why this has occurred – but the basic gist is as follows… There are growing fears about the contracting growth in the private sector.
Recent economic reports indicate a slowdown in economic growth, stoking investors’ fears about the economic future. Here’s a rundown:
- Released September 3rd – ISM (Institute for Supply Management) Manufacturing Index reported at 47.2, failing to meet analysts expectations of 47.5.
- Released September 4th – The S&P Global U.S. Manufacturing PMI report shows a slowdown in manufacturing from July to August.
So what’s next? S&P 500 is indeed approaching a previous market gap. Will it be sufficient to provide a bounce after this flash crash?
Technical Analysis of S&P 500 (September 5th, 2024)
As we’ve detailed in a previous analysis, the S&P 500 was consolidating at a previous market gap which acted as resistance.
Since then, it has broken down and chopped past the daily 20-EMA.
Looking back at previous patterns, the daily 20-EMA has consistently acted as a key support level during uptrends. So, a break of the daily 20-EMA signals potential bearish continuation.
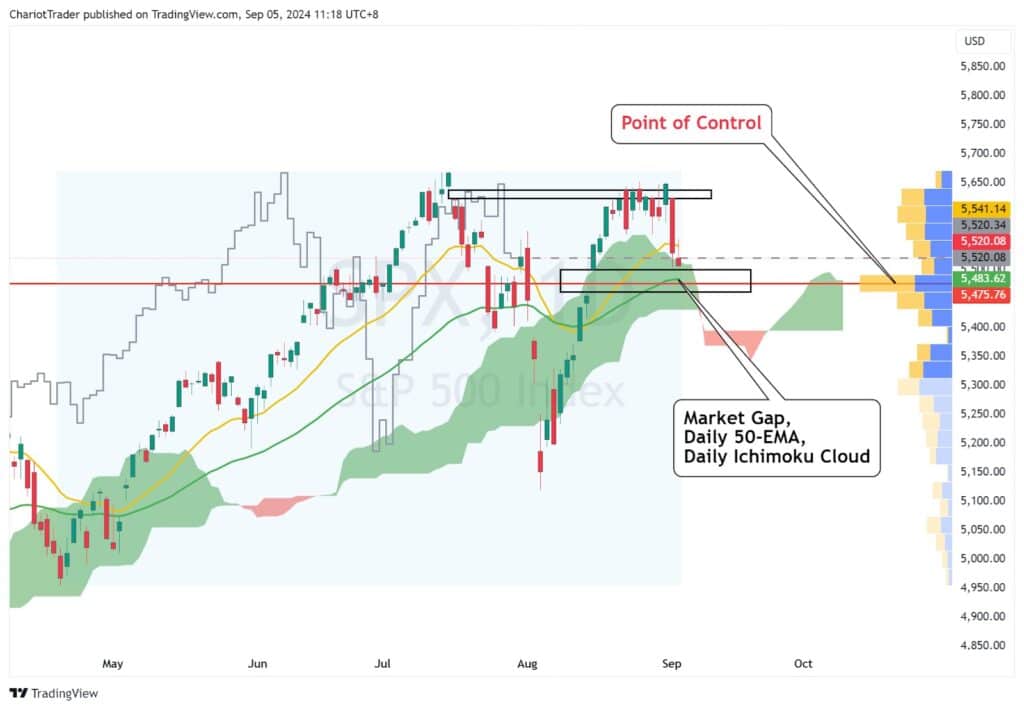
On the daily timeframe, we can see a market gap approaching on the S&P 500, at roughly $5,500 to $5,426. This gap aligns with several other support levels.
| Levels of Support to Watch on S&P 500: • Market Gap (August 14th to 15th): $5,500 to $5,462 • Ichimoku Cloud Support: $5,510 to $5,430 • Daily 50-EMA: $5,483.62 • Point of Control: $5,475.76 – formed from April 19, 2024 |
How can we gain more confidence in a market recovery?
The Ichimoku Cloud provides a more nuanced approach to assessing a potential market recovery. With the price having dipped into the green cloud, a move back up and out of the cloud could signal a positive shift and suggest that a recovery may be underway.
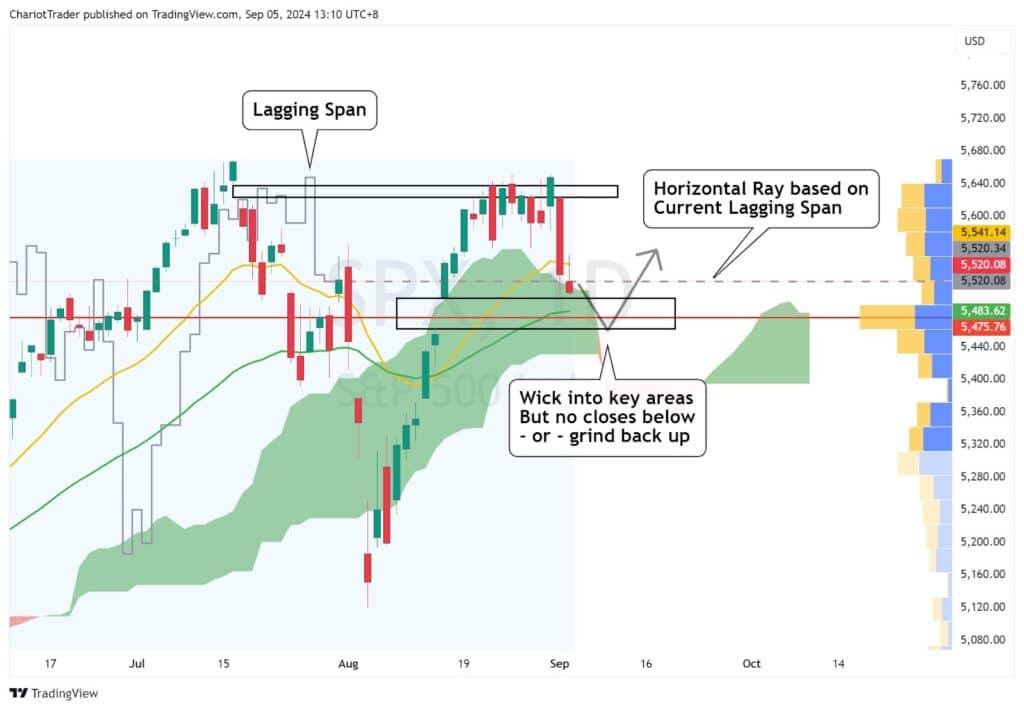
On the chart above, you’ll see that I’ve marked out the key factors for you to judge if a market recovery could be underway. Keep in mind that this strategy is based on the Ichimoku Cloud, and not all strategies will have a 100% hit rate.
I expect the price to come to test the key support areas within the market gap, but not form any closes underneath the gap. Then, if the price does begin to grind up, I will watch for the following to happen:
- The price has moved outside of the green Ichimoku Cloud.
- The price has surpassed the height of the lagging span, which we can mark out by drawing a horizontal ray.
When these two factors are met, it will give traders more confidence that a market recovery from here is possible – which should also have a cascading effect across other markets such as Nasdaq 100, and Bitcoin (Cryptocurrencies as whole).
Closing Thoughts
Overall, I will be watching these factors for a potential recovery, although my personal expectations are that the general markets will be dropping. This is only an analysis of a potential scenario that may come.
You may also be interested in:
US Oil – Sell-off Due to Libyan Supply


