- Chart of the Day
- December 23, 2024
- 2 min read
Make or Break: S&P 500 Continuation or Fall to $5,650 Possible
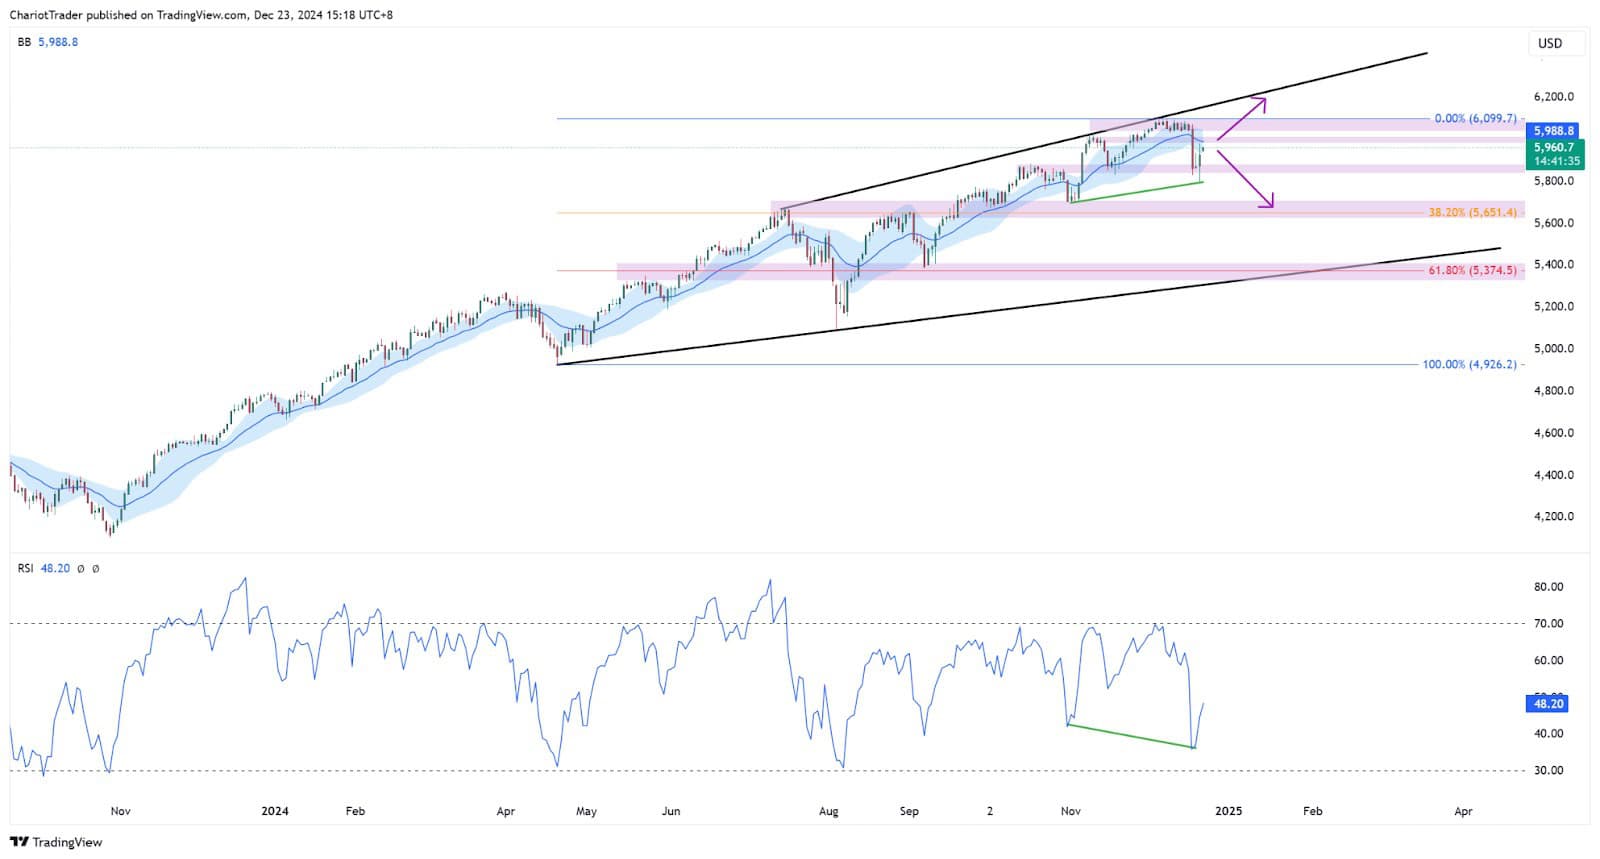
Following the Fed’s hawkish FOMC meeting last Wednesday, the price of the US 500 index (S&P 500) took a slump of approximately -3.08% in just a single day, marking the largest bearish candle since November.

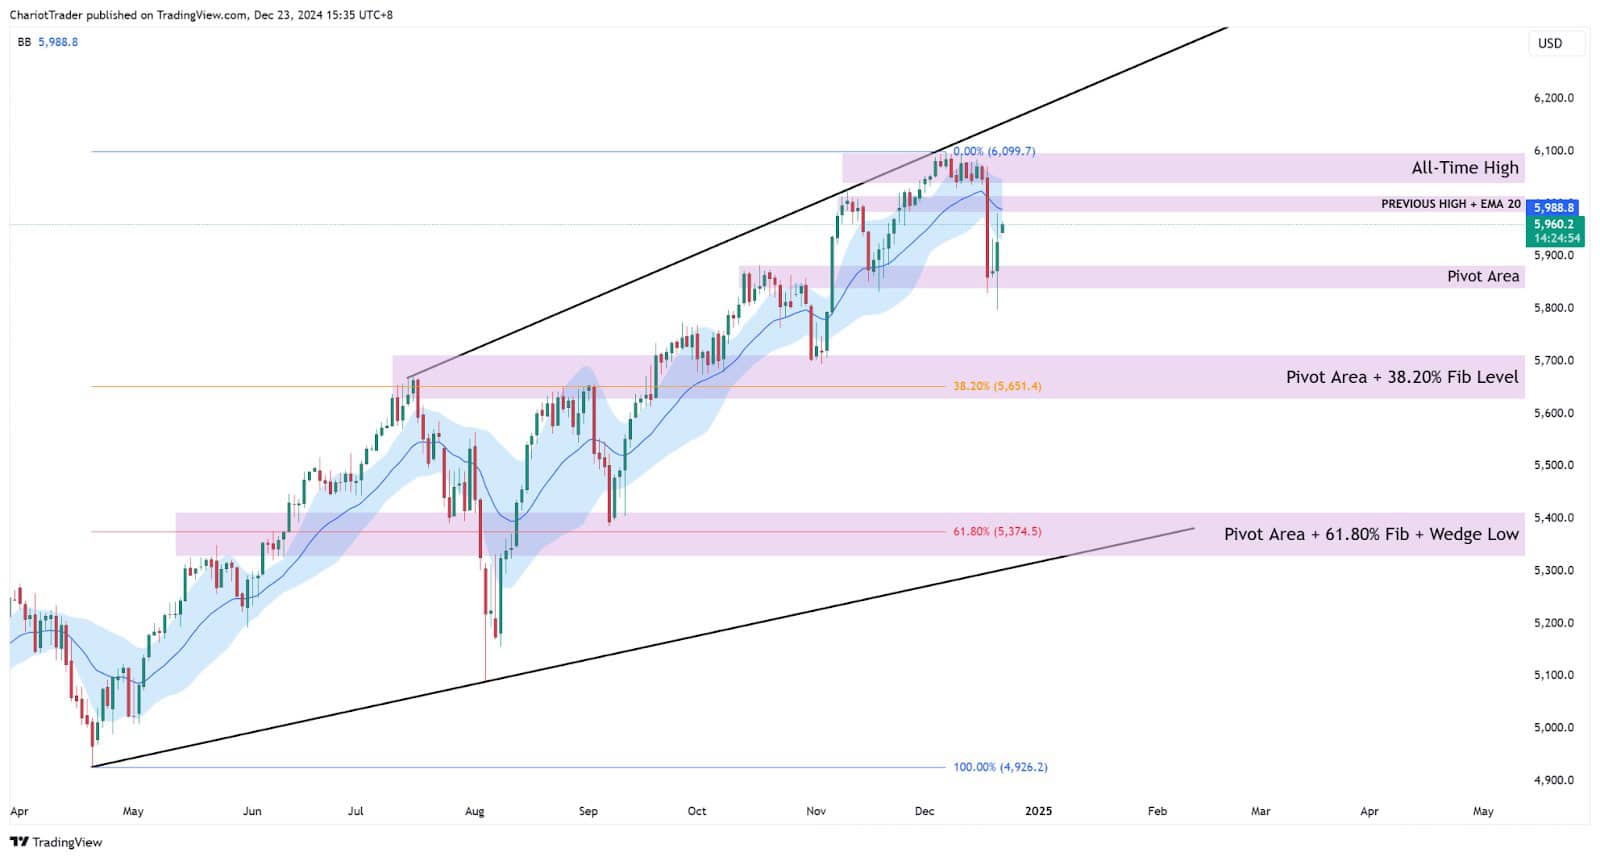
Amidst these bearish signals however, is a bounce off the $5,840 – $5,880 region with a daily hidden bullish divergence. This signals a possible continuation to the top of the wedge and even the possibility of creating a new All-Time High. However, the index must first get past key resistance zones and the 20-Daily Exponential Moving Average before rising to new highs.
Technical Analysis Levels to Watch on S&P 500
Currently, the S&P 500 index has broken past its daily EMA-20, which has acted as a great dynamic, trending support. This is illustrated on our chart with a Bollinger Bands® indicator with standard deviation set to one.

The recent plummet on Wednesday has officially created a trend shift, according to the Bollinger Bands (EMA-20), as it has completely broken down from the bands.
This now makes the Previous High + EMA 20 zone the first resistance zone to watch, at approximately $5,984.00 to $6,015.30. If price cannot get above this area, S&P 500 may see a price decline back to its Pivot Area at $5,840 – $5,880, or even lower towards the 38.20% Fibonacci Retracement at $5,651.40.
A plummet as such would invalidate the hidden bullish divergence signal, as a lower low would be formed.
Conversely, if the price can get above the Previous High + EMA 20 zone, we can potentially see further rise into new highs, whereby the key resistance would be the current ATH of $6,099.70.
The ultimate support level to watch would be the Pivot Area + 61.80% Fib + Wedge Low area at approximately $5328.30 to $5412.70.
If broken, the S&P 500 could spiral towards $5,000 or even its 2022 ATH at $4,780 – however, this is a situation that is, for now, far from being realised.
You may also be interested in:


