


Written by:


- Chart of the Day
- August 15, 2024
- 3 min read
Fed Pivot Likely in September, S&P 500 Near Key Resistance
The Fed Pivot has all but been confirmed with yesterday’s CPI y/y data, documenting a 2.9% reading compared to last month’s 3.0% reading.
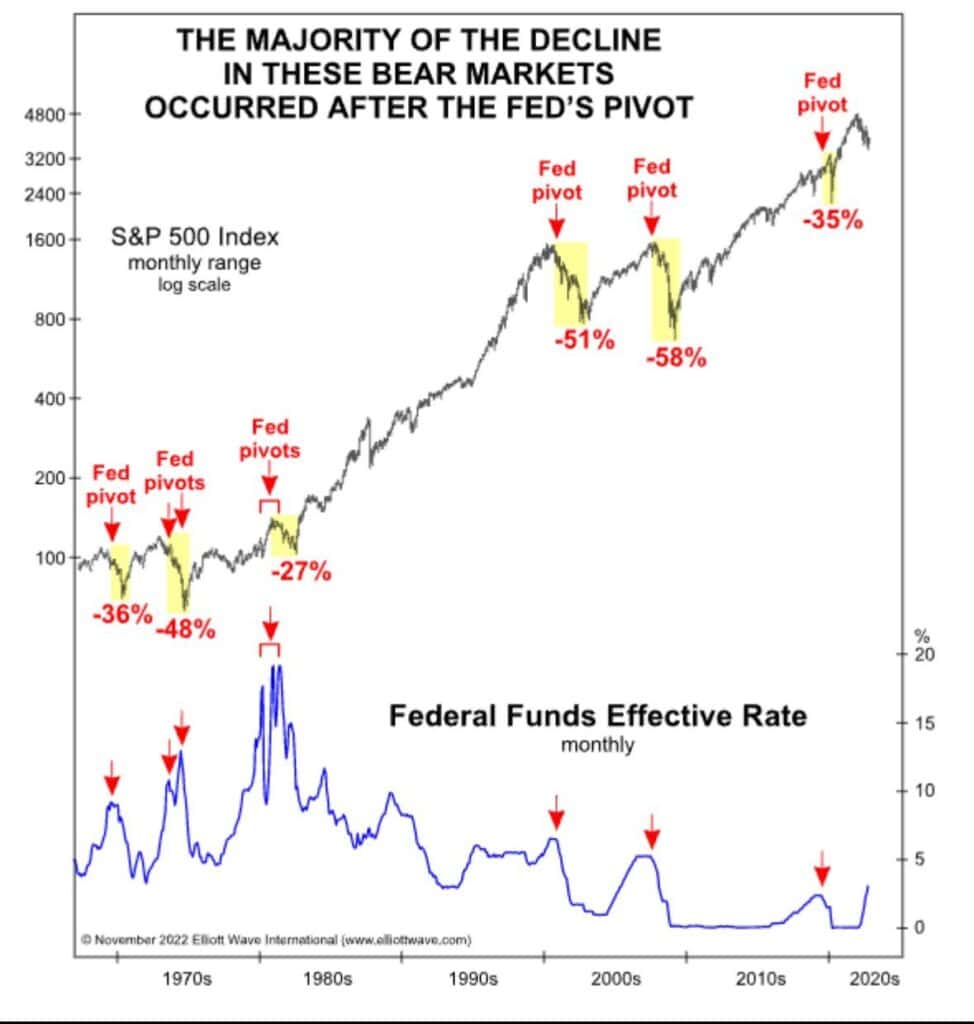
Fundamentally, this CPI data is bullish for the markets, but at the same time, Fed Pivots are notoriously known for a following market crash ensuing. Sometimes, however, a market rise occurs before a wild drop to the downside.
These mixed sentiments can cause traders to hesitate, not knowing which direction of the trade to take. Truth be told, nobody knows either – we don’t have a crystal ball that tells the future.
What we do know is, the S&P 500 has been able to reclaim EMA 20, 50, 100, as dynamic support levels with a consecutive 5 day rise. The asset now is approaching key resistance levels at around the $5,470 zone, which may offer some difficulties in further rise – at least in the short term.
Technical Analysis of S&P 500 (August 15th, 2024)
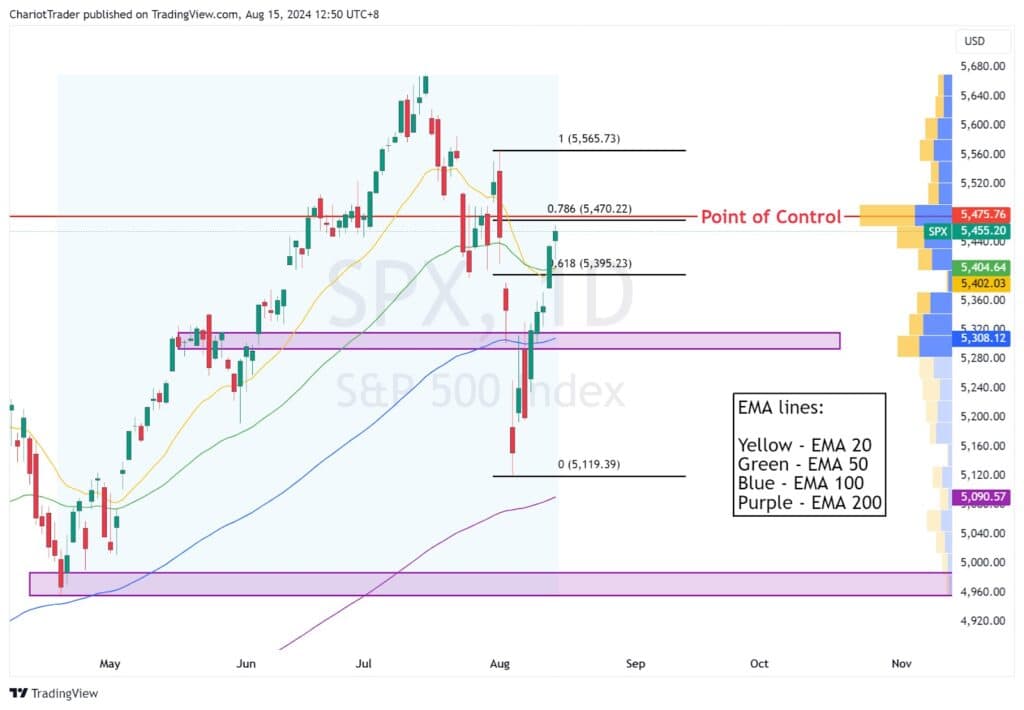
As documented above, the S&P 500 (SPX or US500 ticker) is currently approaching a 786 fib retracement level at $5,470.22, drawn from the recent high to recent low.
Additionally, when taking into account the trading volume since April 2024, we can find a Point of Control price at $5,475.76, which sits extremely close to the 786 fib. This point of control indicates the historic price level with the highest level of interest from traders, and could create a reaction once price reaches there.
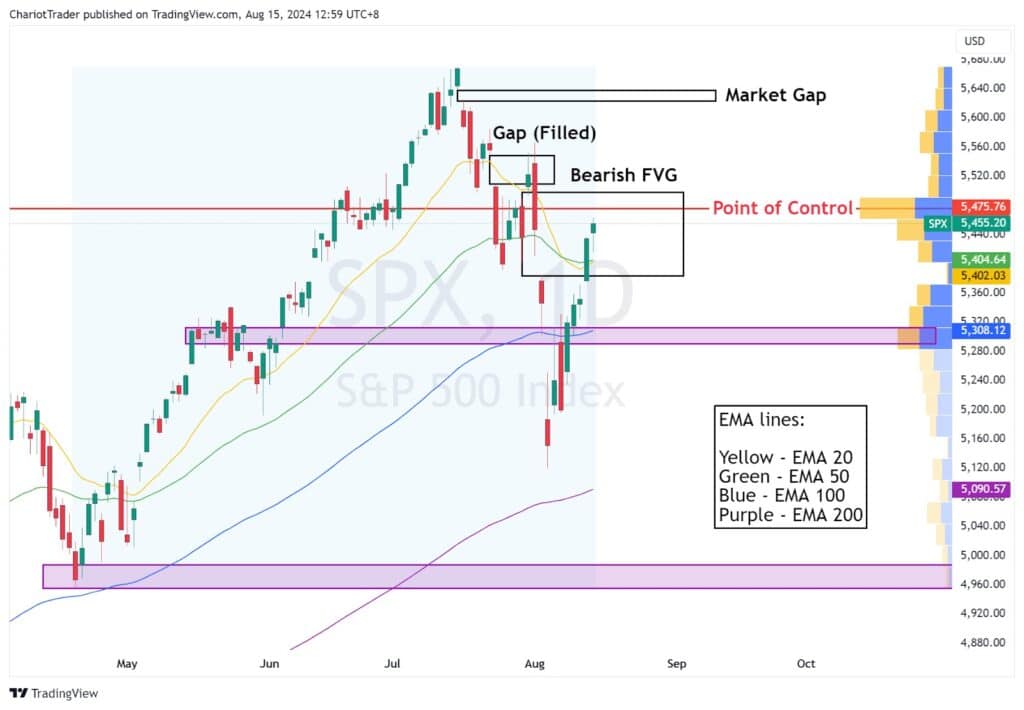
Expanding on this analysis with more advanced concepts, we can observe two price gaps that may provide a degree of resistance on the S&P 500:
- Daily bearish fair value gap (FVG), from $5,493.75 to $5,383.89
- Market gap at the All-Time Highs, from $5,639.02 to $5,622.49
While these resistances could play a part in continuing S&P 500’s price decline, in the broader context of an anticipated rate cut, they may only create a smaller decline. In such a scenario, the support levels to watch would be:
- EMA 100 and previous consolidation zone, around $5,300
- Psychological level, at $5,000
- Major Pivot Low, at $4,953.56
Closing Thoughts
As the market digests the recent CPI data and its implications for the Fed’s monetary policy, we’re entering a critical juncture for the S&P 500.
While the CPI data appears fundamentally bullish, the history of market behavior following Fed pivots serves as a cautionary reminder of high volatility ahead.
The S&P 500’s ability to reclaim key EMA levels signals strength, but the nearby resistance around $5,470 may limit short-term gains.
These resistance zones, reinforced by the 786 Fibonacci retracement and Point of Control, are crucial decision points. Price gaps, particularly the bearish fair value gap and market gap at all-time highs, could trigger short-term pullback, with a slight potential to trigger a major reversal.
In summary, while the short-term trend is upward, caution is advised as key resistances could lead to pullbacks and increased volatility, possibly causing resistance and support zones to be temporarily overshot (or falsely breaking) before a reversal occurs.
You may also be interested in:
Following the RBNZ’s rate cut, we anticipate no unexpected rise in CPI
DJI Elliott Wave: Bulls and Bears in a Staring Contest


