


Written by:


- Chart of the Day
- September 30, 2024
- 3 min read
Rise or Fall: Will EMA-20 Be Nasdaq’s Key to Further Upside?
The Nasdaq (USTEC) may be gearing up for another push to the upside. With the DXY closing a bearish weekly candle below a key support level, and the Nasdaq breaking back above its EMA-20 while breaching a weekly triangle pattern, these are bullish signals for the asset.
However, there are signs that a short-term retrace could be imminent. Should this happen, traders may begin to view the Daily EMA-20 as a magnetic line of support for the Nasdaq, as it has done so in the past during trending moves.
Nasdaq Closes Above Triangle, Targets Sub-23K

The Nasdaq has closed above its EMA-20 once again, the second time in the last three months. This move aligns with the formation of a multimonth triangle pattern starting in July.
The breakout target for this triangle sits at approximately $22,900, which would represent a 14.60% increase from the current price.
However, traders must be mindful of the resistances overhead, which is a mix of the All-Time High, and round numbers that could act as psychological resistance:
- All Time-High at $20,762.70
- $21,000
- $21,500
- $22,000
- $22,500
- Breakout Target at approx. $22,900
Nasdaq has Short-Term Signals for a Retracement to EMA-20
The Nasdaq’s daily timeframe is showing a double top on its Stochastic RSI. Historically, this signal has typically led to a minor retracement, with the price often dipping back to the Daily EMA-20 before resuming its bullish momentum.
Here are the instances where the Stochastic RSI was overbought or formed a double top, resulting in a brief retrace to the EMA-20 before continuing upward:
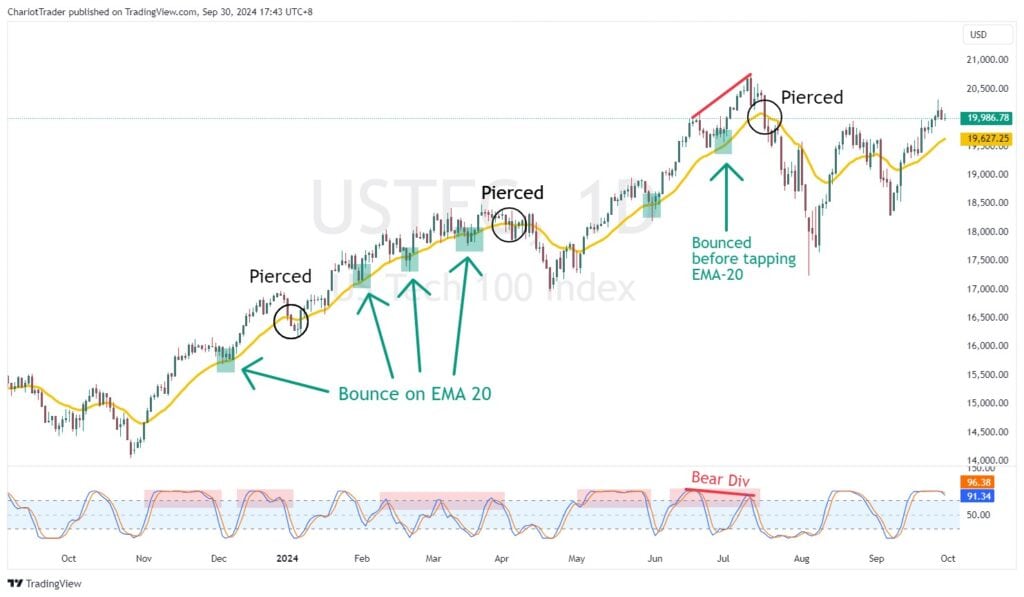
As you can see, when the Daily EMA-20 curves upwards, the Stochastic RSI’s overbought or double top signals tend not to result in significant price declines.
More times than not, the Daily EMA-20 acts as a magnetic support line, giving Nasdaq’s strength to grind further up, towards new highs.
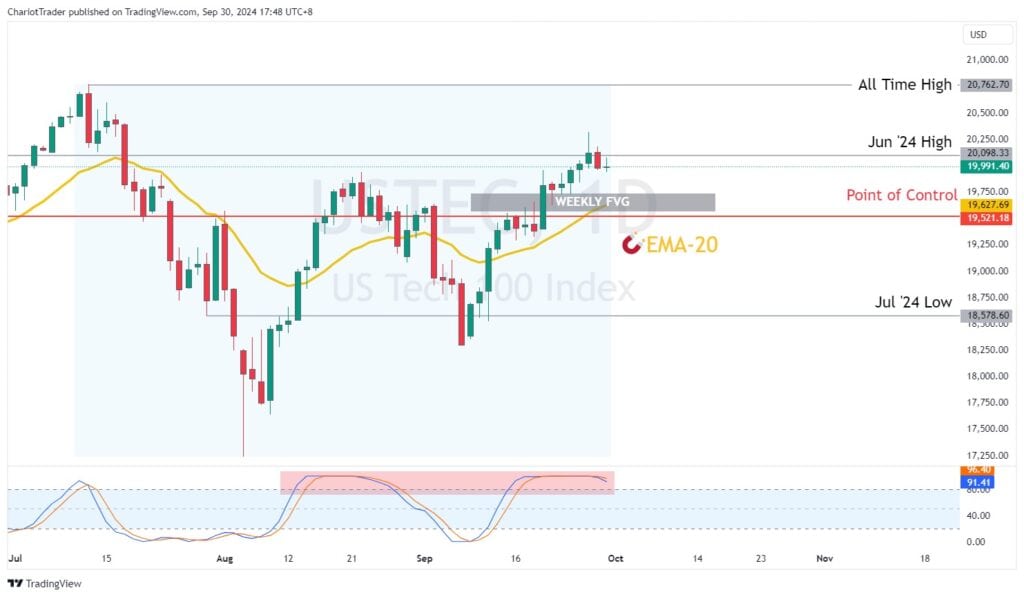
Zooming in on the chart, we can see the Daily EMA-20, Point of Control, and Fair Value Gap aligning to form a potential support zone between $19,568 and $19,740.
Here’s a breakdown of each support level:
- EMA-20
- Dynamic and subject to change, requiring monitoring
- Approx. $19,627.69
- Weekly FVG
- A price gap that typically acts as a magnetic support or resistance zone
- From $19,568 to $19,740
- Point of Control
- Price level with the highest trading volume, measured from the All-Time High on 11 July 2024
- Currently at $19,521.18
Given the presence of an overbought and Double Top signal on the Stochastic RSI indicator, the price of Nasdaq could see a retracement to this zone in the upcoming days.
Weak DXY Could Give Nasdaq Opportunity to Rise
The DXY has closed a bearish weekly candle under the December ‘23 Pivot Lows at 100.641, which means the US Dollar could weaken even further.
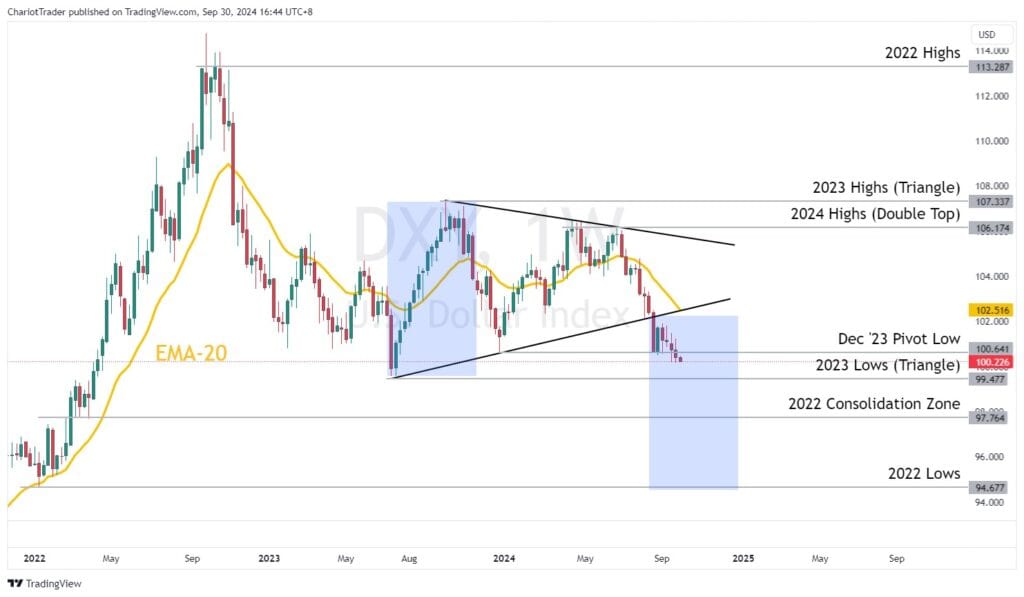
The next major support level for the DXY would be the 2023 Lows at 99.477, but a break of that would spell even more danger for the dollar – potentially going towards its 2022 Lows at 94.677.
This is all good news for the Nasdaq. However, one should keep in mind that the US Fed Pivot and US elections could throw a wrench in the Technical Analysis of the DXY and Nasdaq.
You may also be interested in:
Netflix Stock Forms All-Time Highs, Eyes $800.00
With Inflation Cooling, All Eyes Turn to Jobs


