- Chart of the Day
- July 23, 2024
- 2 min read
Dollar Bearishness Continues: DXY Approaches Channel Resistance
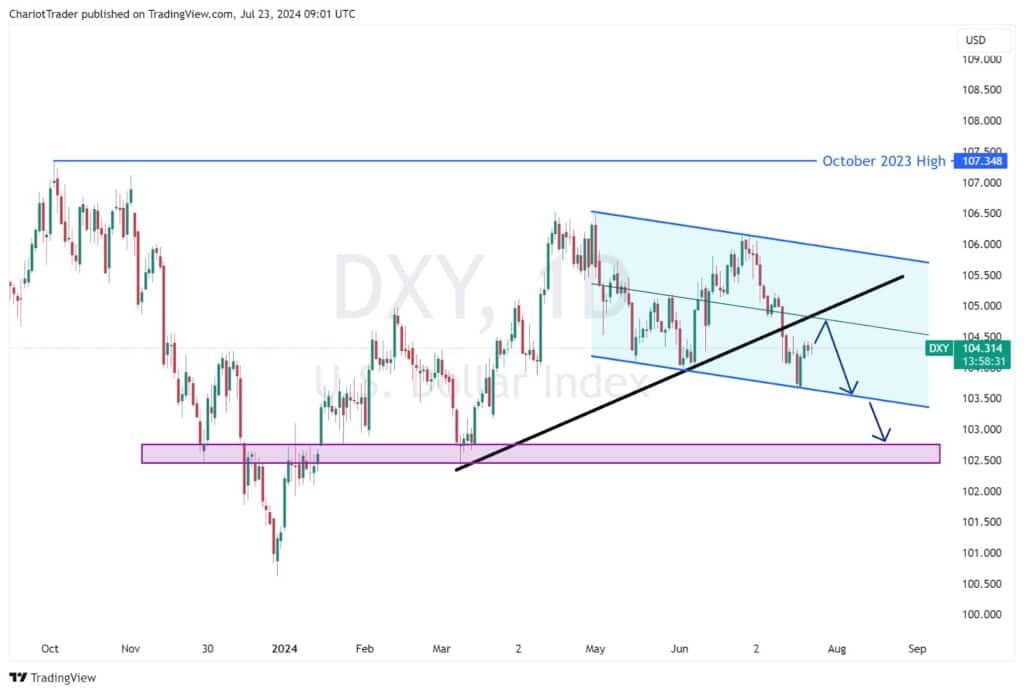
Reignited hopes for a September rate cut have sent the Dollar Index tumbling to 103.650 in July. As the DXY finds support from a descending channel established since May 2024, it’s now rapidly approaching a crucial resistance zone between 104.500 and 104.800.
Traders are watching closely to see if this zone will halt the DXY’s rebound or signal further volatility.
Technical Analysis of DXY (July 23rd, 2024)

The DXY is currently facing an overlap of significant resistances up ahead: the midpoint of a descending channel, and a weekly trendline formed since March of 2024.
Give or take, these resistances are overlapping at around 104.500 – 104.800. However, if the DXY can reclaim the channel’s midpoint and continue climbing up, we may see a retest of the channel highs at approximately 105.800.
Levels to watch in the meantime:
- Channel Midpoint + Weekly Trendline resistance: 104.500 – 104.800
- Channel Lows: Approximately 103.650
- Previous Daily Lows: Approximately 102.800 – 102.400
That being said, the majority of market participants are anticipating a rate cut. The Fedwatch Tool has projected a >90% probability of a 25 basis rate cut on September 18th.

Source: CME Group, July 23, 2024
As we move further along in Q3, the anticipation of a rate cut may further depress the dollar and lift the rest of the markets.
The upcoming FOMC meeting at the end of this month will be crucial, as it will offer critical insights into the likelihood of a September rate cut. Stay tuned for the details.
You may also be interested in:
Alchemy Q3 Forecast: Commodities


