


Written by:


- Chart of the Day
- April 14, 2025
- 4 min read
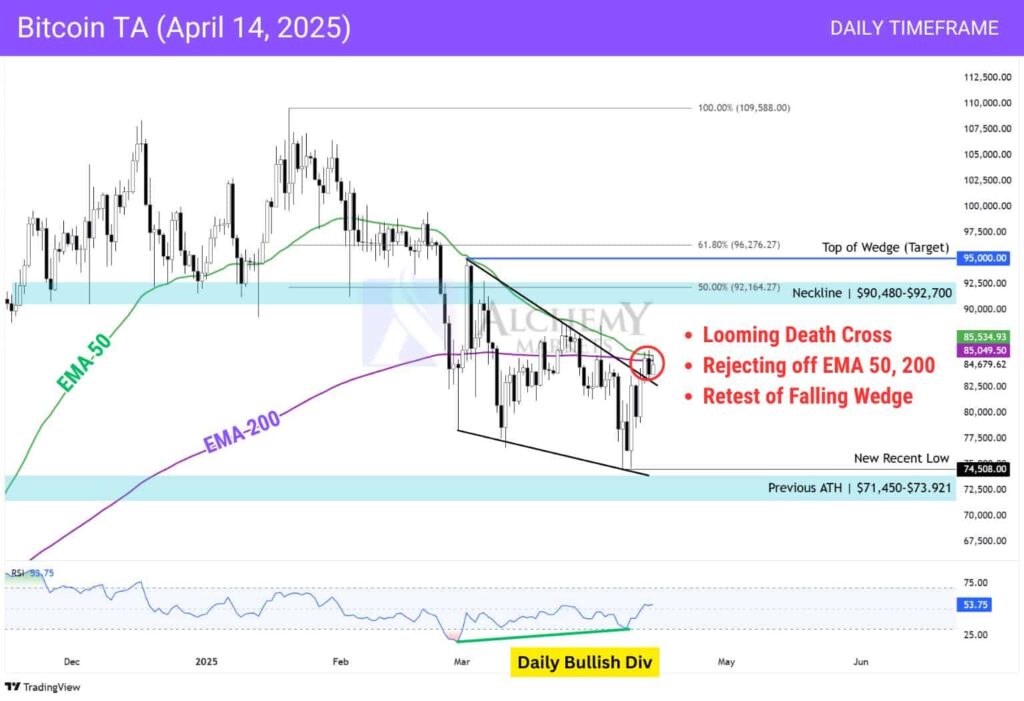
Looming Death Cross on Bitcoin as Dollar Hits Three-Year Lows
Bitcoin’s breaking out of a falling wedge and retesting structure highs — ha, a classic reversal setup.
But let’s not sugarcoat it: there’s a looming Death Cross on the daily, and that’s a red flag worth watching. Historically, these crosses (50 EMA slicing below the 200) get billed as bearish — but in crypto’s twisted logic, they often mark bottoms, not breakdowns.
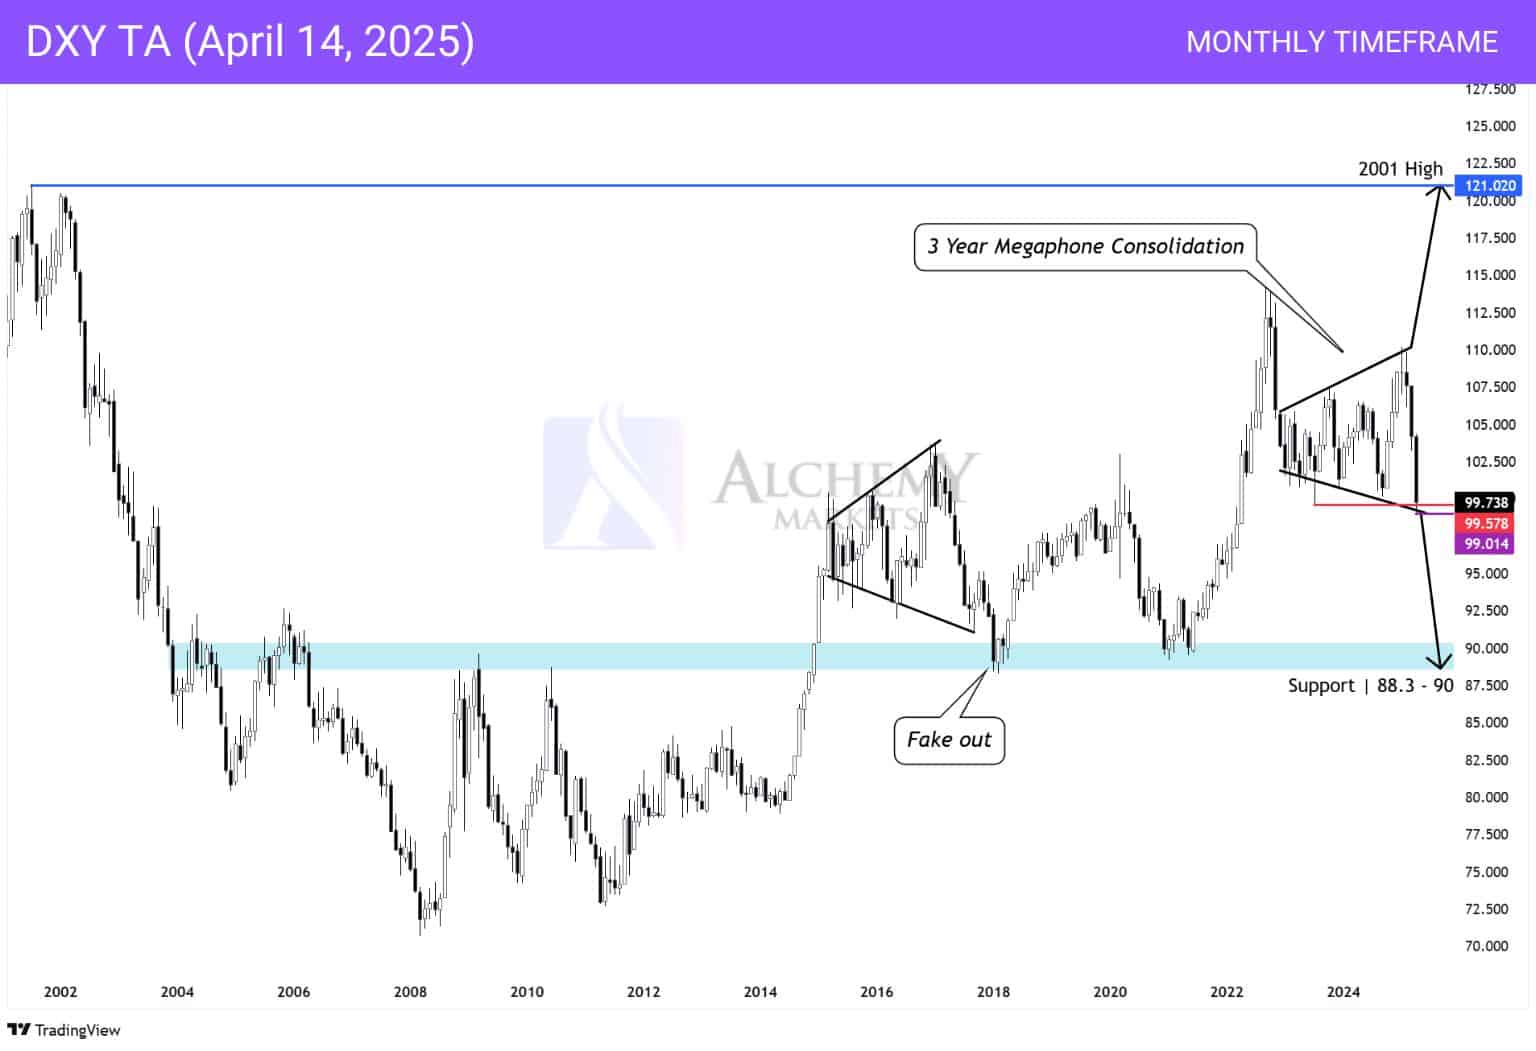
Meanwhile, with China ramping up its tariffs on the US in retaliation, the US dollar is seeing pressure to the downside. The Dollar has hit its lowest point in three years, wicking to ~99.04, while many were expecting 100 to hold.
So when we stitch this together, what’s the playbook for Bitcoin and the DXY from here?
Bitcoin Daily Chart — Death Cross Bear Trap Almost in Fruition
Bitcoin has been known to bottom whenever a death cross—the Daily EMA 50 crossing below the 200—flashes on the price chart. Though this has not yet come to fruition, there have been moments where a looming Death Cross in itself has signalled the bottom, such as in September 2024.
Does this mean that Bitcoin’s bottom is currently in? No.
Currently, the price is being rejected by the 50 and 200 exponential moving averages, so there’s still a possibility we can re-enter the falling wedge’s range. If this happens, a rejection from here down to $71,450 is possible.
If Bitcoin can break above the daily 50 and 200 EMAs, a rise to these prices are on the cards:
- Previous swing high near $88,600
- 50% Fib level at $92,160
- Falling wedge measured move around $95,000
- And the 61.8% retracement at $96,275
In short: keep your eyes on the EMAs. We’re at a technical fork.
Dollar Sinks — DXY Hits Three-Year Lows Amid Trade Tensions
Over in FX land, the dollar’s under the gun. DXY just wicked down to 99.04 — the lowest print in three years — as trade tensions between the U.S. and China pick up steam. Markets were expecting 100 to hold. It didn’t.
On the monthly chart, DXY’s carved out a megaphone (expanding triangle) structure — and that sets up a broad range. Breakout targets point either toward the 2001 highs or 2018 lows, depending on which edge gives first.
But geopolitics will drive the next leg. China’s tariff retaliation throws another wrench into the mix. Traders should keep a close eye on recent developments.
What does this mean for the Yen Carry trade?
The current market setup may be hinting at the early stages of a Yen carry trade unwind—but we’re not there yet.
- The DXY is falling, hitting a three-year low near 99.04. That suggests the USD is under broad pressure, not gaining strength as it would during a full unwind.
- Bitcoin is bouncing, breaking out of a falling wedge and retesting structure. That’s typical of risk-on behaviour—again, not something we’d expect if USD strength from a carry unwind was fully underway.
- Japanese equities have been outperforming, and even Warren Buffett is doubling down on Japan. This might signal investors are repositioning ahead of a policy shift from the Bank of Japan—but they haven’t started yanking money out of U.S. markets yet.
For context, the carry trade works like this: investors borrow Yen at near-zero rates, convert to USD, and funnel that into higher-yielding US assets like equities or bonds. It’s a core engine of global liquidity. But that engine may soon sputter.

Bottom line?
We’re in a pre-unwind positioning phase. For now, the dollar’s weakness and crypto strength suggest the carry trade is still intact, but traders are watching closely for the inflection point.
You may also be interested in:


