


Written by:

- Chart of the Day
- May 26, 2025
- 3 min read
Is Risk Back? AUD/JPY Eyes Bullish Reversal Pattern
As I sip my coffee for the day, I noticed something interesting about the Aussie-Yen chart.
This asset is known to be a proxy for risk sentiment in the market. This means; when AUD/JPY is decreasing, large institutional investors are risk-off. When it’s increasing, institutional investors are risk-on.
In layman’s terms? When AUD/JPY is bullish, so is the Nasdaq, S&P 500, Dow Jones, and Bitcoin — usually.
So with that said, what did I notice? AUD/JPY could be forming a bullish inverse head and shoulders reversal after a prolonged downtrend. The asset is potentially finding support at 92.00, and could complete the pattern if 95.75 is broken to the upside.
AUD/JPY Daily Chart Analysis: Inverse Head and Shoulders
Notice how the price of AUD/JPY was in a downtrend for the good majority of Q1 2025. The pair then rallied strongly from the lows at ~86, and saw a >11% rise towards the 0.382 Fibonacci Retracement in May.
While this rally was impressive, the fact remains: its previous highs were not broken (95.26 to 95.75), so it still remains in a larger downtrend. Despite the rejection, we now could be seeing support areas (91.74 to 93.05) holding up the AUD/JPY price.
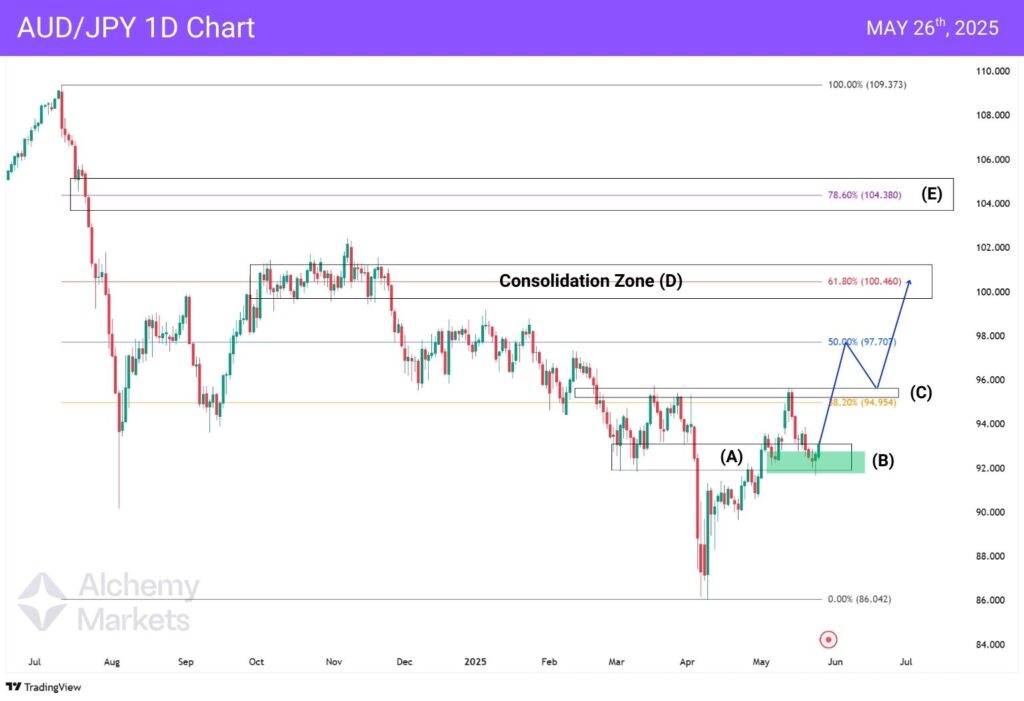
If this area holds, and the price shifts beyond 93.05, a short rally towards the prior highs could happen again, with that resistance acting as the neckline of the inverse head and shoulders.
| Watchzones | ||
| A | 91.81 – 93.05 | Wick zones of previous lows |
| B | 91.74 – 92.71 | Bullish fair value gap |
| C | 95.26 – 95.75 | Neckline of inverse head and shoulders |
| D | 99.40 – 101.40 | Consolidation area with 61.80 Fib resistance |
| E | ~104.00 – 104.60 | Measured move target with 78.6% Fib resistance |
Key Takeaway:
If AUD/JPY holds here, and shifts out of (A) beyond 93.05, the chances for a bullish rally increases dramatically; not just for the pair, but also for risk-on assets — market indices, stocks, and cryptos — across the board.
Macro Considerations
Given the ongoing tariff trade tensions, especially after last week’s market whiplash following Trump’s announcement of a potential 50% tariff on EU zone imports, AUD/JPY’s inverse head and shoulders pattern may not play out as expected — or could even see a failed breakout.
The recommendation here is to KIV (keep in view) these global economic developments, and monitor upcoming U.S. and Japanese bank rate decisions in the coming weeks.
Also — on May 29th, Japan will release its Tokyo Core CPI y/y data. Depending on the figures, the outlook for the Bank of Japan’s rate stance could shift. For now, market consensus is that the BoJ will hold rates steady. But if CPI exceeds the forecast of 3.5% (vs previous 3.4%), this could further reduce expectations of a rate cut, as stronger inflation data may reinforce the BoJ’s more cautious, wait-and-see approach. Conversely, a miss in CPI could revive speculation that the central bank may resume easing later this year.
For AUD/JPY, stronger Japanese inflation data — and the reduced likelihood of BoJ easing — would support a firmer yen, potentially capping upside attempts and weakening the bullish breakout narrative. On the other hand, lower CPI data could weaken the yen and give AUD/JPY the runway it needs to test the neckline at 95.75.
You may also be interested in:


